Fig. 6.
Download original image
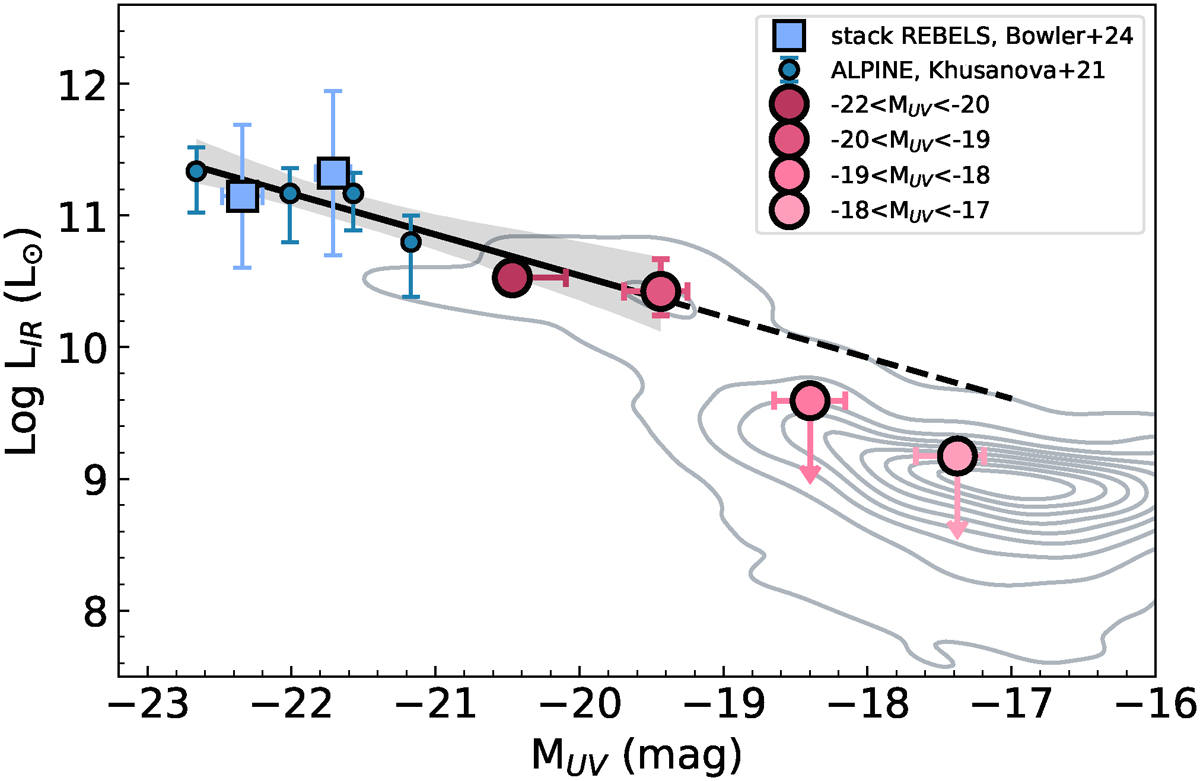
Infrared luminosity as a function of UV magnitude. The contours show the position of the whole sample with LIR obtained from the fit using the ALMA constraint. Big circles with black borders are the weighted median values in four UV magnitude bins. Stacked or median values for samples from the literature are shown in various shades of blue symbols (Bowler et al. 2024; Khusanova et al. 2021).
Current usage metrics show cumulative count of Article Views (full-text article views including HTML views, PDF and ePub downloads, according to the available data) and Abstracts Views on Vision4Press platform.
Data correspond to usage on the plateform after 2015. The current usage metrics is available 48-96 hours after online publication and is updated daily on week days.
Initial download of the metrics may take a while.