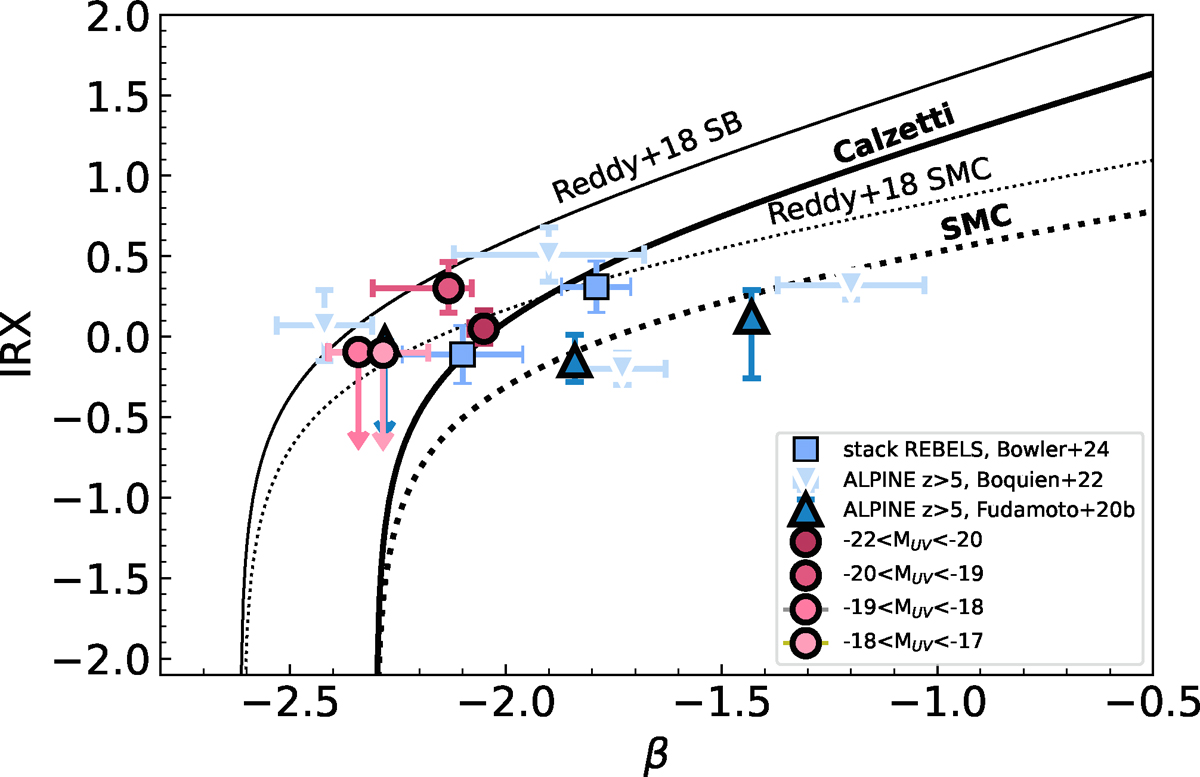
Fig. 7.
Download original image
IRX as a function of β. Coloured circles with black borders are weighted medians derived in four UV magnitude bins from our sample. The blue squares are the stacked values of Bowler et al. (2024) for the REBELS sample. The light blue downward triangles are the ALPINE z > 5 from Boquien et al. (2022), while the dark blue triangles are ALPINE stacks at z > 5 values from Fudamoto et al. (2020). The solid thick black line is the relation assuming a Calzetti et al. (2000) attenuation law, while the dotted line is the one assuming a SMC-like extinction curve. The thin black lines are the corresponding relations from Reddy et al. (2018).
Current usage metrics show cumulative count of Article Views (full-text article views including HTML views, PDF and ePub downloads, according to the available data) and Abstracts Views on Vision4Press platform.
Data correspond to usage on the plateform after 2015. The current usage metrics is available 48-96 hours after online publication and is updated daily on week days.
Initial download of the metrics may take a while.