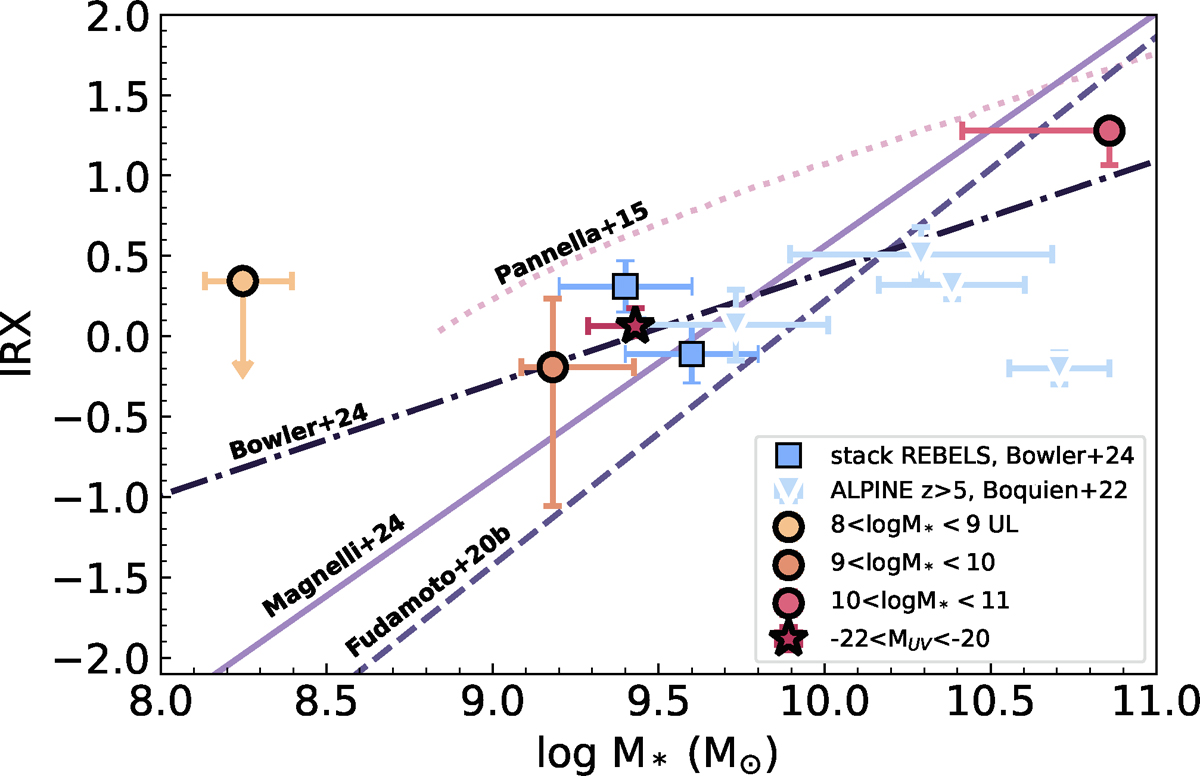
Fig. 8.
Download original image
IRX as a function of stellar mass. Circles with black edges are weighted medians colour-coded according to the stellar mass bin used for stacking. The red star is the position of the −22 < MUV < −20 bin for direct comparison with the stacked values of Bowler et al. (2024) for the REBELS sample (blue squares). The light blue downward triangles are the ALPINE z > 5 stacks values from Boquien et al. (2022). The solid light purple line is the relation from Magnelli et al. (2024), the dashed line is from Fudamoto et al. (2020), the dash-dotted line is the relation from Bowler et al. (2024), and the dotted light purple line the relation from Pannella et al. (2015) at lower redshifts. The darker the color of these relations, the higher the redshifts of the galaxies used to derive them.
Current usage metrics show cumulative count of Article Views (full-text article views including HTML views, PDF and ePub downloads, according to the available data) and Abstracts Views on Vision4Press platform.
Data correspond to usage on the plateform after 2015. The current usage metrics is available 48-96 hours after online publication and is updated daily on week days.
Initial download of the metrics may take a while.