Fig. 3.
Download original image
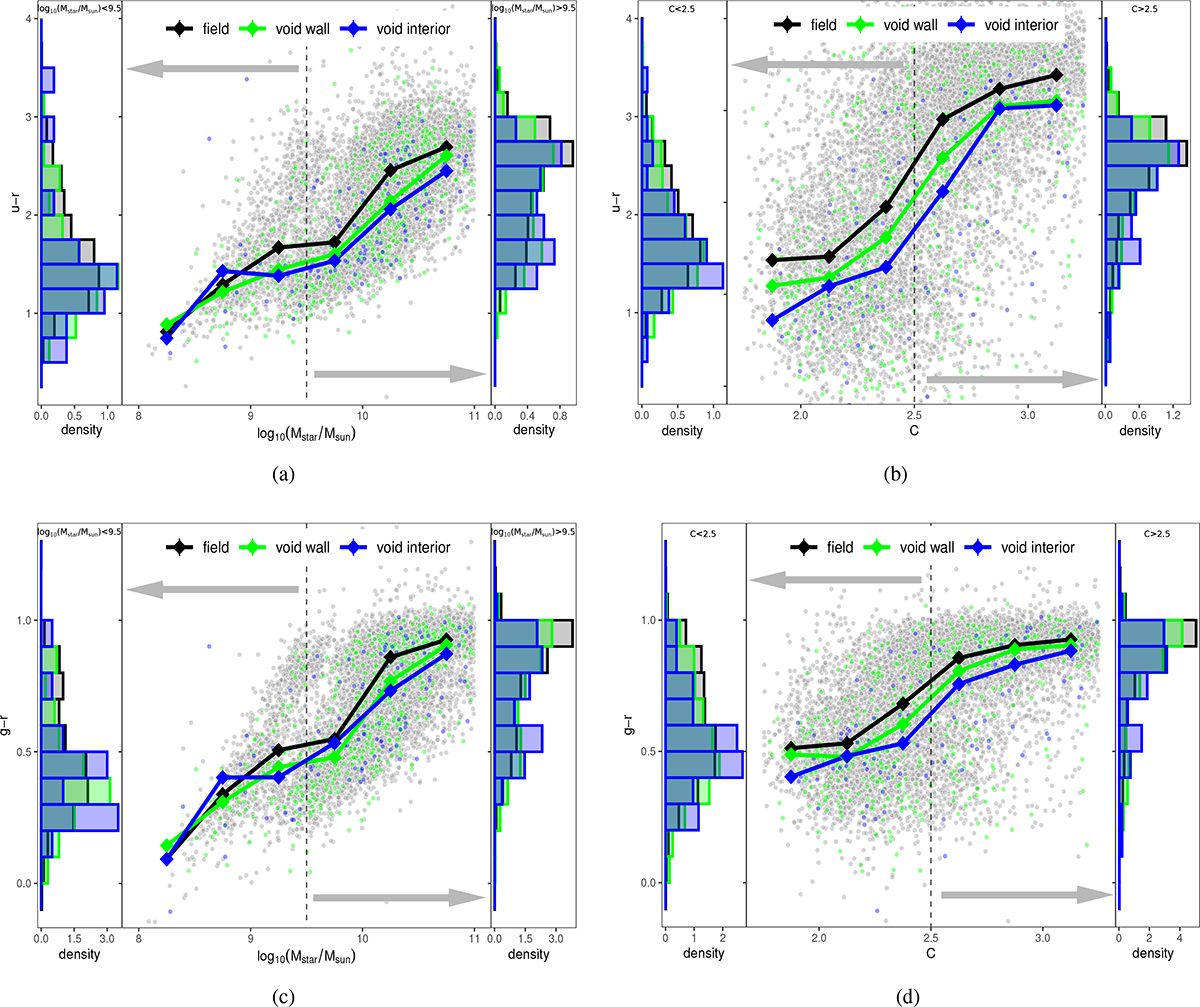
Study of stellar mass and concentration impact on color void paired galaxies. (a) Central panel: Scatter plot of u − r as a function of log(M*/Msun) for pair galaxies in voids (blue), in wall (green), and in fields (black). Diamonds and solid lines indicate the median. The vertical dotted line represents log(M*/Msun)=9.5. Left panel: Normalized distribution of g − r for log(M*/Msun)< 9.5 paired galaxies in voids and field. Right panel: Same as in the left panel but for log(M*/Msun)> 9.5. (b) Central panel: Scatter plot of u − r as a function of concentration index for pair galaxies in voids (blue), in wall (green) and in fields (black). Diamonds and solid lines indicate the median. Left panel: Normalized distribution of g − r for C < 2.5 paired galaxies in voids and field. Right panel: Same as in the left panel but for C > 2.5. (c) Central panel: Scatter plot of g − r as a function of log(M*/Msun) for pair galaxies in voids (blue), in wall (green), and in fields (black). Diamonds and solid lines indicate the median. The vertical dotted line represents log(M*/Msun)=9.5. Left panel: Normalized distribution of g − r for log(M*/Msun)< 9.5 paired galaxies in voids and field. Right panel: Same as in the left panel but for log(M*/Msun)> 9.5. (d) Central panel: Scatter plot of g − r as a function of concentration index for pair galaxies in voids (blue), in wall (green), and in fields (black). Diamonds and solid lines indicate the median. Left panel: Normalized distribution of g − r for C < 2.5 paired galaxies in voids and field. Right panel: Same as in the left panel but for C > 2.5.
Current usage metrics show cumulative count of Article Views (full-text article views including HTML views, PDF and ePub downloads, according to the available data) and Abstracts Views on Vision4Press platform.
Data correspond to usage on the plateform after 2015. The current usage metrics is available 48-96 hours after online publication and is updated daily on week days.
Initial download of the metrics may take a while.