| Issue |
A&A
Volume 700, August 2025
|
|
|---|---|---|
| Article Number | A196 | |
| Number of page(s) | 13 | |
| Section | Extragalactic astronomy | |
| DOI | https://doi.org/10.1051/0004-6361/202453369 | |
| Published online | 20 August 2025 | |
Galaxy pairs in cosmic voids
1
Instituto de Astronomía Teórica y Experimental, (IATE-CONICET), Laprida 854, X5000BGR Córdoba, Argentina
2
Departamento de Geofísica y Astronomía, CONICET, Facultad de Ciencias Exactas, Físicas y Naturales, Universidad Nacional de San Juan, Av. Ignacio de la Roza 590 (O), J5402DCS Rivadavia, San Juan, Argentina
3
Observatorio Astronómico de Córdoba, Universidad Nacional de Córdoba, Laprida 854, X5000BGR Córdoba, Argentina
⋆ Corresponding author: This email address is being protected from spambots. You need JavaScript enabled to view it.
Received:
9
December
2024
Accepted:
23
May
2025
Abstract
We present a statistical analysis of different astrophysical properties of a sample of galaxy pairs in cosmic voids. The sample consists of 72 galaxy pairs with projected separations and relative radial velocities rp < 100 h−1 kpc, ΔV < 500 km s−1 in the redshift range z < 0.1. We compared the different results for this pair sample to those derived for matched samples configured in absolute magnitude, stellar mass, and concentration residing in void, wall, and global averaged environments. We find that the pair galaxies in voids tend to have bluer optical colors than the corresponding galaxies in the wall and field environments, regardless of their stellar mass and concentration, which indicates a more recent formation of the bulk of stars. We also obtained larger mid-IR color indices for the void paired galaxies with respect to the corresponding matched samples in the wall and field environments. However, we found significantly larger differences for galaxies with a high mass and concentration. We also note that a mid-IR color-color diagram of the results showed void pair members consistent with the locus of star forming galaxies, in contrast to the other environments that exhibit a bimodal behavior comprising both passive and star forming objects. The Dn(4000) parameter also shows a significant younger stellar population in paired galaxies in voids. This is also reflected in the higher star formation rate values, which show a greater efficiency for void paired galaxies. We note that the star formation efficiency is greater for void paired galaxies with a high stellar mass and concentration. We also find that the efficiency of star formation associated with galaxy interactions is significantly greater in pairs residing in cosmic voids. This increased star formation activity could be associated with the expected richer gas environment and a gentler dynamical behavior as compared to the more eccentric orbits and stronger interactions and mergers more likely to occur in the wall and field environments.
Key words: methods: statistical / catalogs / galaxies: interactions / large-scale structure of Universe
© The Authors 2025
 Open Access article, published by EDP Sciences, under the terms of the Creative Commons Attribution License (https://creativecommons.org/licenses/by/4.0), which permits unrestricted use, distribution, and reproduction in any medium, provided the original work is properly cited.
This article is published in open access under the Subscribe to Open model. This email address is being protected from spambots. You need JavaScript enabled to view it. to support open access publication.
1. Introduction
Galactic interactions serve as a powerful mechanism for altering different galaxy properties that primarily trigger star formation activity (Alonso et al. 2006, 2012; Barton et al. 2000; Lambas et al. 2003, 2012; Kennicutt 1998; Mesa et al. 2014; Pearson et al. 2019, 2022) and reshape both galaxy morphology and the stellar mass function. The underlying physical mechanisms of galaxy-galaxy interactions have been elucidated through theoretical and numerical analyses (Martinet 1995; Toomre & Toomre 1972; Barnes & Hernquist 1992, 1996; Mihos & Hernquist 1996). Studies have revealed that tidal torques generated during close encounters lead to collisional disruption, material dissipation, and gas inflows. Moreover, galaxy mergers contribute to the growth of supermassive black holes at galactic centers (Alonso et al. 2007; Dotti et al. 2012; Ellison et al. 2019), with the efficacy of this process being contingent on the gas reservoir and internal characteristics of the interacting galaxies. Collectively, these effects underscore the significance of galaxy mergers in the evolutionary trajectory of galaxies. In this context, according to hierarchical structure formation models, galaxy mergers and interactions play a crucial role in the structure formation scenario of the Universe (Woods & Geller 2007; Bournaud 2010).
Moreover, these effects are heavily contingent on the specific local environments where galaxy interactions take place (Alonso et al. 2006, 2012; Lambas et al. 2003, 2012; Das et al. 2021), with a preference for occurrences within group environments (Barton et al. 2007; McIntosh et al. 2008). While a robust correlation between the rate of galaxy mergers and the environment was observed at high redshifts (z ≈ 1), with elevated merger rates in dense regions (Lin et al. 2010; de Ravel et al. 2011), this dependence weakens considerably in the local Universe (Darg et al. 2010; Ellison et al. 2010). Galaxies within massive cluster environments exhibit fewer signs of interactions and mergers compared to those in groups or fields (McIntosh et al. 2008; Tran et al. 2008; Alonso et al. 2012; Kampczyk et al. 2013), primarily due to the high relative velocities of galaxies in clusters, which inhibit mergers (Deger et al. 2018; Benavides et al. 2020; Sureshkumar et al. 2024). In addition, Skibba et al. (2009) observed that the likelihood of a galaxy undergoing a merger or interaction is largely uncorrelated with the environment, except at projected separation scales of 100 kpc h−1. Intermediate density environments, as highlighted by Perez et al. (2009a), foster efficient close encounters and mergers. More recently, Sureshkumar et al. (2024) found that mergers exhibit a preference of occurring in the underdense regions on scales greater than 50 kpc h−1 of the large-scale structure. Simulation studies also support an environmental dependence of mergers, with semi-analytic models showing varying strengths of this dependence (Jian et al. 2012). Additionally, simulations suggest that galaxy pairs tend to avoid extreme environments such as clusters and cosmic voids (Tonnesen & Cen 2012).
Extremely low density regions referred to as “cosmic voids” have emerged as prominent components of the large-scale Universe. They are an integral part of a more extensive and complex network, namely, the cosmic web. Although voids make up more than 40% of the total volume in galaxy surveys, their low galaxy density (lower than 20% compared to the average density of the Universe) limits the availability of suitable samples for statistical analysis (Pan et al. 2012; Ceccarelli et al. 2013). Therefore, studying voids requires large surveys covering vast areas and deep depths. Studies on galaxies in voids have been carried out, and the results show objects in primitive stages, which is consistent with a slower evolution of galaxies in voids (Beygu et al. 2016, 2017). Mostly devoid of galaxies, the few structures that inhabit voids are characterized by higher star formation activity, bluer colors, a lower mass, and a late-type morphology with significant amounts of gas compared to galaxies in an average density environment (Grogin & Geller 2000; Park et al. 2007; von Benda-Beckmann & Müller 2008; Ceccarelli et al. 2008, 2012; Kreckel et al. 2011; Ricciardelli et al. 2014, 2017; Liu et al. 2015; Moorman et al. 2016; Beygu et al. 2016, 2017; Rodríguez-Medrano et al. 2023; García-Benito et al. 2024). Domínguez-Gómez et al. (2023) showed that galaxies in void structures, on average, exhibit slower star formation histories compared to galaxies in denser large-scale environments. That is, galaxies in voids evolve more slowly than in filaments, walls, and clusters. In addition, active galaxies have been detected and studied in cosmic voids, which have proven to be promising candidate locations for hosting active galactic nuclei (Constantin et al. 2008; Liu et al. 2015; Amiri et al. 2019; Ceccarelli et al. 2022).
Cosmic voids are exceptional regions filled with pristine gas, and they have unique dynamic conditions characterized by velocity fields dominated by divergent flows with low velocity dispersion (Padilla et al. 2005; Ceccarelli et al. 2006; Paz et al. 2013; Hamaus et al. 2015; Correa et al. 2022). Due to the enormous extension of cosmic voids, it is reasonable to expect that the galaxies that inhabit them also formed and evolved within them. In this context, voids are positioned as scenarios with a formidable potential for understanding the formation and evolution of galaxies, including the effects of interactions.
The particular environment and dynamics of cosmic void interiors have important consequences for the evolution of galaxy pairs. In effect, given a present-day pair of interacting galaxies in a regular environment, the member galaxies of such a pair have probably been separated by several megaparsecs at early times and have a large negative pairwise velocity. In contrast, pairs in a cosmic void have significantly lower pairwise velocities compared with the global dynamics of the pair as a whole. Void expansion dominates the dynamics of galaxy pairs, imprinting characteristic signatures on their orbits. Thus, it is expected that the evolution of the astrophysical properties of void pair members may be significantly different, and they therefore deserve an appropriate analysis. In this direction, acquiring and analyzing paired galaxies situated within cosmic voids poses a significant challenge due to their low galactic density and specific dynamics. Nevertheless, these particular environments offer an exceptional opportunity to study paired systems and galactic interactions devoid of external influences. They also provide an invaluable chance to gain profound insights into the impact of interactions on galactic properties and their evolutionary processes.
The paper follows this structure: Section 2 outlines the methodology for selecting pair systems within cosmic voids. In Section 3, we carefully obtain pair galaxies in wall and field environments exhibiting comparable redshift, luminosity, mass, and morphology as the galaxy pairs located in void regions. In Section 4, we present analysis of void environment effects on paired galaxies, with a detailed examination of their colors, star formation rates, and stellar populations in comparison with pair systems located in wall and field environments. Section 5 presents our discussion of the findings and a summary of the key conclusions. Throughout this paper, we adopt a cosmological model characterized by the parameters Ωm = 0.3, ΩΛ = 0.7, and H0 = 70 km s−1 Mpc−1.
2. Selection of pair systems in cosmic voids
The data utilized in this study has been sourced from the Sloan Digital Sky Survey (SDSS), one of the most remarkable astronomical survey (SDSS; York et al. 2000). Spanning several operational phases (SDSS-I, 2000−2005; SDSS-II, 2005−2008; SDSS-III, 2008−2014), the SDSS has consistently released its data to the scientific community on an annual basis. With the advent of the latest iteration, SDSS-IV (2014−2020) (SDSS-IV; Blanton et al. 2017), the survey has entered a new realm, pushing the boundaries of precision cosmological measurements into the pivotal early epochs of cosmic evolution through eBOSS. Additionally, it has expanded its infrared spectroscopic survey of the Galaxy across both northern and southern hemispheres with APOGEE-2, and has introduced the Sloan spectrograph to create spatially resolved maps of individual galaxies through MaNGA.
For this work, we employ the full initial galaxy pair sample obtained from Mesa et al. (2018). To identify these pairs, they selected galaxies with a projected separation of rp < 100 kpc h−1 and relative radial velocities of ΔV < 500 km s−1, limited to z < 0.1. According to these criteria, the sample consists of 25965 galaxy pairs spanning the SDSS Legacy Survey region. This extense area encompasses a diverse local and global density environments, including structures such as galaxy groups, clusters, filaments and cosmic voids, where these galaxy pairs are located. The data used to compile this galaxy pair sample were sourced from the Main Galaxy Sample (MGS; Strauss et al. 2002), obtained from the fits files on the SDSS website1. For this sample, k-corrections were performed and band-shifted to z = 0.1 using the k-correct_v4.2 software by Blanton & Roweis (2007). K-corrected absolute magnitudes were derived from Petrosian apparent magnitudes, converted to the AB system.
Following the procedures of Ceccarelli et al. (2006) and Padilla et al. (2005) we obtain a catalog of voids, using a volume limited sample of galaxies brighter than Mr < −20.1 which corresponds to redshift z < 0.12. The final sample comprises 363 voids with integrated density δ < −0.9. The total number of galaxies within voids is 5590. This catalog features the right ascension, declination, and redshift of the center of each void as well as the radius in h−1 Mpc (Rv). The radius ranges from 5 to 22 h−1 Mpc and the maximum redshift is z = 0.12. A detailed analysis of the spatial and dynamical properties of voids identified in a similar way has been carried out in Ceccarelli et al. (2013) and Paz et al. (2013).
In order to locate galaxy pairs within cosmic voids, we conducted a cross-correlation between the sample of paired galaxies and the void catalog. With this aim we compute the cosmological distances across between the paired galaxies and the center of each void, requiring that said distance be less than the size of the void. We also defined the following regions: the void interior (void), from 0 to 0.8 Rv, and the void wall (wall), from 0.8 to 1.2 Rv.
The region selected between 0.8 and 1.2 Rv, used to identify galaxy pairs situated in the transition region of cosmic voids (void wall), represents a simplification, as the intrinsic shapes of voids are far more complex than a simple spherical model (Pérez et al. 2024). Void structures often exhibit irregular, peanut-like shapes and are frequently deformed by the dominant tidal forces of surrounding mass concentrations. Additionally, the non-spherical nature of voids means that spherical averaging can mix different internal layers of a void (Courtois et al. 2023). In this context, a fraction of pair galaxies located at 0.8 to 1.2 Rv in our sample may still reside within cosmic voids, depending on the void’s specific geometry and structure.
Moreover, aiming to contrast the impact of galactic interactions within cosmic voids against those are from them, in average environments, we selected paired galaxies in the field, considering the distance to the nearest void: the field environment (field), from 1.8 to 3.0 Rv. The first two zones are related to the cosmic voids, and an additional region is situated in the field outside the voids. In addition, the void interior and wall comprises underdense regions, whereas the field corresponds to average global densities. The global density of the field is ∼0.012 galaxies per Mpc3 and is used for comparison purposes.
Following this procedure we found 72, 790, and 10411 galaxy pairs in the center, wall and field respectively (see Table 1). We emphasize the small number of pair systems (72) found within the interiors of voids which aligns with the low number density of galaxies in these regions. In addition, the deficiency of pair systems in these regions underscores the challenges of galaxy interaction in such isolated and underdense environments.
Restrictions and numbers of total galaxy pairs and matched pairs in the different regions.
In addition, we selected galaxies in void interior, void walls and in the field, without neighbors at distances smaller than 150 h−1 Mpc and radial velocity differences smaller than 500 km s−1, hereafter non-interacting galaxies. In order to perform appropriate comparisons we construct control samples of non–interacting galaxies having similar stellar lass, luminosity, redshift and concentration distributions than the corresponding pair galaxies. The control samples of non–interacting galaxies encompass 1824, 3700 and 9029 objects in the void interior, void wall and field environments, respectively.
3. Matched pair samples
Here, we focus our attention on the impact of the particular void environment on galaxy interactions. For this aim, we employed a Monte Carlo algorithm to obtain carefully pair galaxies in wall and field environments exhibited comparable distributions of redshift, r-band absolute magnitude, and stellar masses as the void galaxy in pairs in our sample (matched samples, see panels a, b and c in Fig. 1). Note that to obtain the wall and field matched samples, and throughout this work, we used the individual galaxy properties of paired galaxies.
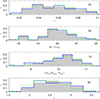 |
Fig. 1. Normalized distributions of redshift, r-band absolute magnitude, stellar masses, and concentration parameter for pair galaxies in voids (blue solid lines), in wall (green dashed lines), and in fields (shaded histograms). |
Moreover, taking these considerations into account, we found that paired galaxies located in walls and fields equal their concentration indices, C2, to those of void pairs, as depicted in panel d of Fig. 1. This parameter discriminates between bulge and disk galaxy types and is also a well tested morphological classification index (Strateva et al. 2001). Moreover Yamauchi et al. (2005) conducted a galaxy morphological classification based on the C parameter, revealing a high level of agreement with visual classification methods. Then, this observation indicates a comparable bulge-disk relationship between the different samples. Thus, any disparities observed in the outcomes can be attributed to environmental influences rather than variations in galaxy morphology.
The methodology employed to obtain matched samples of paired galaxies in wall and field environments ensures that it shares the same selection effects as the void pair catalog. This process facilitates the study of pair features in different environments, elucidating the pure and intrinsic effects of the interaction process that unfold within the cosmic void environment.
Finally, the matched samples of paired galaxies, situated on the walls of the voids and in the field, each comprise 226 and 4395 pairs, respectively (see last column of the Table 1). These catalogs are used in the subsequent analyzes outlined in Section 4.
4. Analysis of void environment impact on paired galaxies
In this work, our focus lies in exploring the properties of galaxy pair systems situated within cosmic voids, where galaxy number density is extremely low. This particular environment offers an exceptional opportunity to explore the features of pair galaxies, devoid of external influences, thus offering deep insights into the effects of interactions on galaxy properties and their evolution. In this context, the subsequent subsections delve into the examination of color, age of stellar population, and star formation activity of galaxy pairs residing in voids in comparison to the pair systems inhabiting the void walls and field regions.
4.1. Effects on optical and infrared colors
Galaxy colors, widely known for their correlation with star formation, stellar population age, and gas content, are also linked to both local and global environments. In this section, our focus is on delving into the colors of paired galaxies situated in cosmic voids. We conduct a detailed analysis of colors within different samples of pairs residing in voids, walls and field environments.
In Fig. 2, the distributions of both color indices (u − r and g − r) are shown for paired galaxies in void, void wall and field environments. Notably, pair systems situated in cosmic voids show a clear excess of bluer colors with respect to those from the matched samples of pairs residing void walls and fields. Furthermore, it is observable that the value u − r ≈ 2.2 effectively demarcates the two peaks of each color distribution, consistent with findings by Strateva et al. (2001). This threshold serves to delineate between the blue and red galaxy populations. This boundary is also reflected in g − r ≈ 0.7. To quantify this trend, we examined the surplus of bluer color indices (u − r < 2.2 and g − r < 0.7) among paired galaxies within the different environment analyzed in this work, finding a clear excess of bluer colors in pair systems located in the inner zones of the cosmic voids (refer to Table 2).
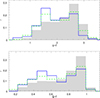 |
Fig. 2. Distributions of u − r and g − r for pair galaxies in voids (blue solid lines), in wall (green dashed lines), and in fields (shaded histograms). |
It is well known that the optical colors of galaxies are linked to their stellar mass (Cucciati et al. 2010), due to this it is convenient to analyze the relation of color indices with stellar mass. In Figs. 3a and 3c we show the u − r and g − r colors as a function of stellar mass, for galaxy pairs in void interior (blue circles), void walls (green circles) and in the field (gray circles). The lines and diamonds display the corresponding median values (field values are shown in black colors). We stress that the C and luminosity distributions of the paired galaxies in void interior, void wall and field are similar for the different stellar mass bins analyzed in this work. We selected high-mass (log(M*/Msun)> 9.5) and low-mass (log(M*/Msun)< 9.5) galaxy samples. The vertical dotted lines in Figs. 3a and 3c indicate this separation. The corresponding color distributions for these samples according to the large-scale environment are shown in the right and left panels, respectively. We note that the same color code is used throughout the paper. As it can be seen in the central panel of the Fig. 3c, galaxies in void interiors and walls tend to have slightly bluer colors than those in the field, particularly for stellar masses log(Mstar/M⊙)≳9. On the other hand, for paired galaxies with extremely low stellar masses (log(Mstar/M⊙)≲9), no significant differences are observed in the median u − r and g − r colors. We also note that the number of galaxies in voids with these stellar mass ranges is very low, which is consistent with the SDSS selection effects in both apparent magnitude and stellar mass.
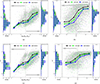 |
Fig. 3. Study of stellar mass and concentration impact on color void paired galaxies. (a) Central panel: Scatter plot of u − r as a function of log(M*/Msun) for pair galaxies in voids (blue), in wall (green), and in fields (black). Diamonds and solid lines indicate the median. The vertical dotted line represents log(M*/Msun)=9.5. Left panel: Normalized distribution of g − r for log(M*/Msun)< 9.5 paired galaxies in voids and field. Right panel: Same as in the left panel but for log(M*/Msun)> 9.5. (b) Central panel: Scatter plot of u − r as a function of concentration index for pair galaxies in voids (blue), in wall (green) and in fields (black). Diamonds and solid lines indicate the median. Left panel: Normalized distribution of g − r for C < 2.5 paired galaxies in voids and field. Right panel: Same as in the left panel but for C > 2.5. (c) Central panel: Scatter plot of g − r as a function of log(M*/Msun) for pair galaxies in voids (blue), in wall (green), and in fields (black). Diamonds and solid lines indicate the median. The vertical dotted line represents log(M*/Msun)=9.5. Left panel: Normalized distribution of g − r for log(M*/Msun)< 9.5 paired galaxies in voids and field. Right panel: Same as in the left panel but for log(M*/Msun)> 9.5. (d) Central panel: Scatter plot of g − r as a function of concentration index for pair galaxies in voids (blue), in wall (green), and in fields (black). Diamonds and solid lines indicate the median. Left panel: Normalized distribution of g − r for C < 2.5 paired galaxies in voids and field. Right panel: Same as in the left panel but for C > 2.5. |
Regarding the colors of paired galaxies in the samples of low and high stellar–mass, for the former (left panel of Figs. 3a and 3c) the means and medians are comparable in voids and field, while for the latter (right panel of Figs. 3a and 3c) galaxies in voids tend to exhibit bluer colors than those in the field.
Furthermore, the color–stellar mass relation depends on the galaxy morphology (Sandage & Visvanathan 1978; Strateva et al. 2001; Baldry et al. 2004; Bundy et al. 2010), consequently, studying dependencies on concentration can be useful to analyze the effect of paired galaxies on their colors. In Figs. 3b and 3d we show the u − r and g − r as a function of concentration, for galaxy pairs in void interior (blue circles), void walls (green circles) and in the field (gray circles). The lines and diamonds display the corresponding median values (field values are shown in black colors). As it can be noticed in the figures, paired galaxies in voids tend to have bluer medians than similar galaxies in the field, for all concentrations analyzed.
In Fig. 4 the color-magnitude diagrams depicting the relationships between u − r and g − r versus Mr for pair galaxies located in cosmic voids are shown. The corresponding matched samples of pairs found in void walls and fields are also included. It can be observed that paired galaxies in fields exhibit an excess of them in the red sequence. In contrast, pairs situated in void walls display a distinct bimodality, evident in both the red sequence and the blue cloud. Furthermore, paired galaxies within void environments tend to cluster toward the green valley and the blue cloud.
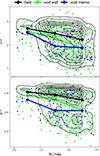 |
Fig. 4. Color magnitude diagrams: u − r (upper panel) and g − r (bottom panel) as a function of Mr for pair galaxies located in voids (blue points), in wall (green points), and in fields (black contours). Connected diamonds indicate the median values. |
Here, we explore the mid-IR colors of pair galaxies. The Wide-field Infrared Survey Explorer (WISE) mid-IR photometry is appropriate to characterize the emission in these frequencies which have important information on the re-emission of light in the mid-IR by the dusty environment associated with star forming regions.
To obtain infrared magnitudes, we used data from WISE (Wright et al. 2010). We employed the all-sky data release and extracted the WISE magnitudes of astronomical sources through matching with our samples of paired galaxies. We obtained 102 galaxies in the void interior, 470 at the void walls, and 7673 in the field. These samples exhibit similar redshift, stellar mass, and concentration distributions.
In Fig. 5, the distributions of the infrared color indices (w1 − w2 and w2 − w3) are presented for paired galaxies across three environments: voids, void walls, and field. Notably, galaxy pairs located in cosmic voids exhibit higher values for both infrared color indices compared to those in void walls and field environments. Moreover, to quantify this trend excess, we examined the surplus of infrared color indices (w1 − w2 > 0.2 and w2 − w3 > 2.5) among paired galaxies within the different environment studied in this work, finding a clear excess of higher values of infrared colors in pair systems located in the inner zones of the cosmic voids (refer to Table 2). Additionally, we notice in this figure the large values of mid-IR colors corresponding to star forming galaxies, following the works of Wright et al. (Wright et al. 2010) and Jarrett et al. (2017).
Percentage of paired galaxies with blue colors located in the void interior environment and for matched samples of pairs in void walls and fields. Standard errors are included.
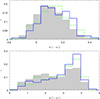 |
Fig. 5. Distributions of w1 − w2 and w2 − w3 for pair galaxies in voids (blue solid lines), in the wall (green dashed lines) and, in fields (shaded histograms). |
We explore the behavior of wise color–color diagram for galaxies in voids, walls and field and we display them in Fig. 6. Each panel in the figure correspond to a large–scale region as is indicated, black point correspond galaxies and the contours indicate iso–density levels. The color–color diagram for galaxies inside voids (right) exhibits a single notable maximum for high values of w1 − w2 and w2 − w3, consistent with a population dominated by galaxies with intense star formation activity. On the other hand, the diagram corresponding to paired galaxies in the field (left panel) presents two prominent maximums, indicating a bimodal behavior, corresponding to passive and star forming galaxies. Specifically, the maximum corresponding to lower color values indicates the existence of a population of passive galaxies, while the one exhibiting higher color values indicates a population of galaxies with active star formation. Regarding paired galaxies in walls (middle panel), they are in an intermediate stage between the field and the interiors of voids, presenting a dominant star forming population and an incipient passive population.
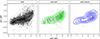 |
Fig. 6. WISE color-color diagrams for pair galaxies located in voids (right panel, blue contours), in the wall (central panel, green contours), and in fields (left panel, gray). |
Since w2 − w3 is linked to star formation activity, which is strongly affected by galaxy mass, we have analyzed the possible dependencies of these colors on stellar mass. In the middle panel of the Fig. 7a we show the color-stellar mass relation for pairs in void interiors (blue), void walls (green) and in the field (black), where the small points correspond to each galaxy in the matched samples and the diamonds and solid lines indicate the median value of w2 − w3. The vertical dashed line indicates the value of stellar mass that divides the sample into low and high masses (log(M*/Msun)=9.5). It is notable that the colors are similar for low-mass paired galaxies (log(M*/Msun)< 9.5) in the analyzed global environments while they differ substantially for high mass paired galaxies (log(M*/Msun)> 9.5), with void paired galaxies (blue and green lines) presenting larger color indices than similar galaxies in the field (black lines). In addition, low-mass galaxies present similar w2 − w3 values, while for high-mass galaxies this tends to decrease if the mass increases. In the left panel of the Fig. 7a we display the w2 − w3 color distribution for low-mass galaxies (log(M*/Msun)< 9.5) and in the right panel the distribution corresponding to high mass galaxies (log(M*/Msun)> 9.5). In agreement with what we have shown in middle panel of this figure, the w2 − w3 distributions are similar for low masses (comparable mean values and standard dispersions, also checked with the KS test) and differ for high masses.
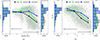 |
Fig. 7. Study of stellar mass and concentration impact on infrared color for void paired galaxies. (a) Central panel: Scatter plot of w2 − w3 as a function of log(M*/Msun) for pair galaxies in voids (blue), in wall (green), and in fields (black). Diamonds and solid lines indicate the median. The vertical dotted line represents log(M*/Msun)=9.5. Left panel: Normalized distribution of g − r for log(M*/Msun)< 9.5 paired galaxies in voids and field. Right panel: Same as in the left panel but for log(M*/Msun)> 9.5. (b) Central panel: Scatter plot of w2 − w3 as a function of concentration index for pair galaxies in voids (blue), in wall (green) and in fields (black). Diamonds and solid lines indicate the median. Left panel: Normalized distribution of g − r for C < 2.5 paired galaxies in voids and field. Right panel: Same as in the left panel but for C > 2.5. |
Furthermore, the w2 − w3 color is related to the morphology of the galaxies (Wright et al. 2010; Jarrett et al. 2017, which leads us to examine the color variations with concentration. The results of the study of the color-concentration relation are displayed in Fig. 7b, the analysis is similar to that carried out for the color-stellar mass relation (Fig. 7a). In the middle panel of Fig. 7b we exhibit the w2 − w3 color as a function of C for the paired galaxies of the matched samples in void interior (blue), void walls (green) and in the field (red). Similarly to the Fig. 7a, the diamonds represent the median values while the dots correspond to individual galaxies. The vertical black dashed line marks the threshold value of C used to classify galaxies into low- and high-concentration categories (C = 2.5). It can be seen in the figure that w2 − w3 decreases as the concentration increases, this is observed for all the explored environments and is consistent with the tendency of the galaxies with higher concentrations to be less active star formers than those with lower concentrations. We can also observed that low concentration paired galaxies (C < 2.5) exhibit similar color-concentration relations in the large-scale environments analyzed, while high concentration galaxies (C > 2.5) show notable differences with the environment, with void galaxies having higher colors than their field counterparts. This result is reinforced by examining the w2 − w3 color distributions for low- and high-concentration paired galaxies in void interiors (blue), void walls (green), and in the field (red), displayed in the left and right panels of the Fig. 7b, respectively (see Table 3).
Percentages of paired galaxies having w2 − w3 > 2.5 selected according to mass and concentration located in the void interior environment, void walls, and field. Standard errors are included.
4.2. Effects on stellar population and star formation activity
To evaluate the influence of the environment on the stellar age populations of the paired galaxies residing in different regions of cosmic voids, we employed the spectral index Dn(4000) (Kauffmann et al. 2003, which assesses the age of stellar populations by calculating the spectral discontinuity at 4000 Å. This discontinuity arises from the aggregation of numerous spectral lines within a narrow region of the spectrum, particularly significant in older stars. In our investigation, we adopted the Dn(4000) definition outlined by Balogh et al. (1999). This definition involves the ratio of average flux densities in narrow continuum bands (3850−3950 Å and 4000−4100 Å), enabling a more precise determination of the ages of the stellar populations under study.
Additionally, we incorporated the specific star formation rate parameter, log(SFR/M*), which serves as a robust indicator of the star formation activity in the context of our analysis. This parameter is computed as a function of the Hα line luminosity and is normalized using stellar masses. The Hα-based specific star formation rates are corrected for dust attenuation using the Balmer decrement and are based on the emission within the 3′′ diameter fiber, which captures only the central regions of galaxies. The aperture corrections have been applied to extrapolate to total specific star formation rate parameter (Kauffmann et al. 2003). The stellar masses considered in this study were determined through photometry fits by the MPA/JHU team, showing slight variations from those derived by Kauffmann et al. (2003) and Gallazzi et al. (2005) using spectral indices with the variances deemed negligible. Furthermore, the star formation rates utilized in our analysis were extracted from the MPA/JHU catalog, computed according to the methodologies outlined by Brinchmann et al. (2004).
In order to provide an analysis of the influence of environmental density on galaxy interactions, we investigated the normalized distributions of log(SFR/M*) for paired galaxies situated in void, wall, and field regions (see upper panel in Fig. 8). It can be seen that pair galaxies located in the interior regions of cosmic voids exhibit higher levels of star formation activity, in contrast to those located in the field. We also note a slight tendency for galaxies in the interiors to be more star forming than those in the void walls. However, this last result should be taken with caution due to uncertainties in star formation rate determinations and stellar population ages derived from spectral data. We also noticed a bimodality of the log(SFR/M*) values, where the two peaks are comparable in field pairs and exhibit a dominant star forming peaks in void pairs. In addition, pair systems within the field display lower values of log(SFR/M*), indicating comparatively less efficient star formation activity. Furthermore, in a similar direction, the lower panel of Fig. 8 demonstrates that pairs within the interior regions of the voids present younger stellar populations (lower Dn(4000) values) compared to their counterparts located in the wall and field. Nevertheless, pair galaxies situated in the field exhibit higher Dn(4000) values, indicating a distinct trend toward older stellar populations. The difference between these distributions was also quantified by the Kolmogorov-Smirnov statistics (with confidence of 99.8%). We can also observe at approximately log(SFR/M*) ≈ −10.6 divides the distributions in two populations. Similarly, galaxies in our samples show a bimodality in the stellar population around Dn(4000) ≈ 1.6. These thresholds have also been used by other authors (e.g., Lambas et al. 2012; Alonso et al. 2012; Fernandez et al. 2024). Table 4 quantifies the percentages of galaxies with efficient star formation activity and a young stellar population in our samples, using these limits as reference. This finding suggests that pair galaxies located in voids exhibit higher star formation activity and younger stellar populations compared to pairs in the matched samples. The observation corroborates our previous findings, which highlighted an increased fraction of paired galaxies within cosmic voids exhibiting bluer colors, as discussed in preceding sections.
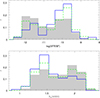 |
Fig. 8. Distributions of log(SFR/M*) and Dn(4000) for pair galaxies in the void interiors (blue solid lines), in void walls (green dashed lines), and in fields (shaded histograms). |
Percentages of paired galaxies with efficient star formation activity and young stellar populations located in the void environment and for matched samples of pairs in walls and fields. Standard errors are included.
We have also explored the dependencies between the age of the stellar population of paired galaxies with their stellar masses and concentration parameter. Our results are shown in Figs. 9a and 9b, whose central panels display the relationship between Dn(4000) with respect to log(M*/Msun) and C parameter for pair galaxies located in the interior and in the wall of the cosmic voids (blue and green colors, respectively), and in the field regions (red colors); lines and diamonds indicate the Dn(4000) median values whereas small points represent individual galaxies. In addition, we categorize samples into low and high-mass galaxies, using a threshold of log(M*/Msun)=9.5 (vertical dashed black line in central panel of Fig. 9a). Similarly, we separate the samples into low and high concentration galaxies, depending on whether this is greater or less than C = 2.5 (vertical dashed black line in central panel of Fig. 9b). This concentration index value is adopted to distinguish between concentrated, bulge-like galaxies (C > 2.5) and more extended, disk-like systems (C < 2.5) (Perez et al. 2009b). As expected, a trend toward older stellar populations is evident as stellar mass and concentration increase for all the samples examined. We observed that more massive galaxies with earlier morphological types (higher C values) exhibit older stellar populations (central panels of the figures). We also note that galaxies in pairs, with low values of stellar mass and concentration, exhibit similar stellar age population, regardless of the galaxy pair position relative to their closest void. On the other hand, paired galaxies with high stellar mass and concentration, show a remarkable disparity in the age of their stellar population, those galaxies in the inner regions of voids are characterized by young stellar populations, compared to pair systems positioned along the walls or in field region. Additionally, the left and right panels of the Figs. 9a and 9b present the normalized distributions of Dn(4000) for the different samples taking into account low and high stellar mass and concentration, which account for the observed behavior.
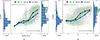 |
Fig. 9. Study of stellar mass and concentration impact on age of stellar population for void paired galaxies. (a) Central panel: Scatter plot of Dn(4000) as a function of log(M*/Msun) for pair galaxies in the void interiors (blue), in void walls (green), and in the field (black). Diamonds and solid lines indicate the median. The vertical dotted line represents log(M*/Msun)=9.5. Left panel: Dn(4000) normalized distribution for log(M*/Msun)< 9.5 paired galaxies in voids and the field. Right panel: Same as in the left panel but for log(M*/Msun)> 9.5. (b) Central panel: Scatter plot of Dn(4000) as a function of concentration index for pair galaxies in the void interiors (blue), in void walls (green), and in the field (black). Diamonds and solid lines indicate the median. The vertical dotted line represents C = 2.5. Left panel: Dn(4000) normalized distribution for C < 2.5 paired galaxies in voids and field. Right panel: Same as in the left panel but for C > 2.5. |
Moreover, we have explored the dependencies of star formation activity on mass and concentration and the results are shown in Figs. 10a and 10c, respectively. The central panels of the figures show the relation between the mean log(SFR/M*) as a function of stellar masses and concentration index of the pair galaxies in the void, wall and field regions. As can be seen, star formation activity decreases toward higher stellar masses and earlier morphological types (higher C values), for all the samples studied in this work.
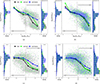 |
Fig. 10. Study of stellar mass and concentration impact on star formation activity for void paired galaxies. (a) Central panel: Scatter plot of log(SFR/M*) as a function of log(M*/Msun) for pair galaxies in the void interiors (blue), in void walls (green), and in the field (black). Diamonds and solid lines indicate the median. The vertical dotted line represents log(M*/Msun)=9.5. Left panel: log(SFR/M*) normalized distribution for log(M*/Msun)< 9.5 paired galaxies in voids and field. Right panel: Same as in the left panel but for log(M*/Msun)> 9.5. (b) Analogous to panel a but for non-interacting galaxies. (c) Central panel: Scatter plot of log(SFR/M*) as a function of C for pair galaxies in the void interiors (blue), in void walls (green), and in the field (black). Diamonds and solid lines indicate the median. The vertical dotted line represents C= 2.5. Left panel: log(SFR/M*) normalized distribution for C < 2.5 paired galaxies in voids and field. Right panel: Same as in the left panel but for C > 2.5. (d) Analogous to panel c but for non-interacting galaxies. |
It is evident, from central panel of Fig. 10a, that low-mass paired galaxies exhibit consistent star formation efficiency, irrespective of their placement within the inner region of the cosmic voids, walls, or field. Conversely, within the high-mass range, galaxies in paired systems situated within cosmic voids tend to display slightly higher levels of star formation activity in comparison to their counterparts located in the wall and in the field. In addition, we categorize the samples into low and high-mass galaxies, using a threshold of log(M*/Msun)=9.5. The Fig. 10a illustrates the normalized distributions of log(SFR/M*), encompassing both low and high mass ranges (left and right panels, respectively) for the different samples examined in this study, elucidating the observed trends.
As can be seen from the central panel of Fig. 10c, early morphological types (high C values) exhibit low star formation efficiency. We also note that galaxies in pairs with low values of C parameter (C < 2.5), indicating low concentration and corresponding to galaxies with spiral-type morphologies, exhibit similar levels of star formation activity, regardless of whether paired systems are situated within the inner regions of voids, on the walls or in the field environments. Conversely, paired galaxies with high concentration members show low star forming efficiency, in agreement with Perez et al. (2009b), Vera et al. (2016). Galaxies paired within the inner regions of voids display a distinct efficiency in star formation, compared to pair systems positioned along the walls or in field region. Furthermore, we classify the samples into low and high-concentration galaxies, using a threshold of C = 2.5. The left an right panels of Figure 10c presents the normalized distributions of log(SFR/M*) for the different samples taking into account low and high concentration parameter, which account for the observed behavior. To quantify these findings, Table 5 presents the percentages of paired galaxies with efficient star formation and young stellar populations, selected accordingly stellar mass and concentration index, across void interiors, void walls, and the field.
Percentages of paired galaxies that have efficient star formation and a young stellar population selected according to star mass and concentration in the void interior, void walls, and field. Standard errors are included.
Additionally, we address the analysis of the effects of interactions on galaxies populating void regions. We examine properties of pair galaxies compared to similar galaxies without close companions in similar large-scale regions for a description of the sample, see the last paragraph in Section 2. Then, differences in the galaxy properties can be associated with pair interaction effects. This analysis allowed us to examine the strength of interaction effects in underdense regions. In Figs. 10b and 10d we display the dependencies of star formation activity on stellar mass and concentration for non-interaction galaxies. The figures are similar to those corresponding to paired galaxies.
As can be observed from Figs. 10b and 10d, non-interacting galaxies in voids present a slight tendency to have more intense star formation activity than those that inhabit the field. Nevertheless, the differences between void and field galaxies are more significant for those in pairs (Figs. 10a and 10c) compared to unpaired or non-interacting galaxies. Galaxies in voids tend to exhibit stronger star formation activity than similar galaxies in the field, and this difference is especially enhanced when these galaxies are interacting with a nearby companion.
By selecting control samples with similar luminosity, redshift, concentration and stellar mass, in each large-scale region, the differences between paired and non-interacting galaxies can be attributed to their interactions. Furthermore, for simplicity, we have only shown results for the star formation activity of non-interacting galaxies because these are qualitatively similar for the other astrophysical properties explored here.
4.3. Contribution of pairs to the star formation efficiency in voids
Finally, we have estimated the contribution of paired galaxies to star formation in voids. We have selected volume-limited samples of paired and non-interacting galaxies in voids, walls, and in the field. These samples are defined by a maximum redshift (z = 0.1) and a limiting luminosity in the r band (Mr = −19.6). We considered different large-scale regions depending on the void-centric distance, as detailed in the following: inner void, from 0 to 0.6 Rv; outer void, from 0.6 to 0.8 Rv; void-wall, from 0.8 to 1.2 Rv; and field, from 1.8 to 2.5 Rv.
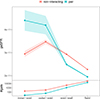 |
Fig. 11. Upper panel: Global specific star formation rate in void regions and the field for paired and non-interacting galaxies. Shaded regions correspond to standard errors. Lower panel: Number of galaxies in the volume-complete samples. |
The numbers of galaxies corresponding to each sample are represented in lower panel of Fig. 11, red color corresponds to paired galaxies and light blue symbolizes non-interacting galaxies.
To quantify the relative contribution of the galaxy pairs to star formation, we introduced a global specific star formation rate (gsSFR), which is calculated by adding the stellar masses formed by each galaxy in the sample divided by the total stellar mass of these galaxies:
 (1)
(1)
The results are portrayed in the upper panel of the Fig. 11, where red line corresponds to pairs and light blue line indicates non-interacting galaxies. As it can be seen, in void interior regions (inner and outer void) star formation is significantly more efficient in paired galaxies than in non-interacting ones. On the other hand, outside void interiors (void-wall and field), in higher density environments, non-interacting galaxies show a higher gsSFR than pairs.
5. Discussion and conclusions
In this work we have analyzed the astrophysical properties of galaxy pairs in cosmic voids. The particular environment of voids, in both galaxy or gas density and dynamics, differs substantially from elsewhere, and it provides suitable conditions to study the pure impact of galaxy interactions with weaker global perturbations. In fact, objects inside cosmic voids have preferentially expanding radial trajectories with small transversal motions. Thus, pair members are expected to have significantly different orbital behaviors and evolutions that would reflect in present-day astrophysical properties. In our study, we focused on the comparison between galaxy pairs in voids, the wall interphase, and the global mean environment (i.e., the field). We constructed matched pair samples that allowed us to study galaxy properties such as optical colors, mid-IR photometry, and spectroscopically derived star formation rates and stellar population ages. The matched wall and field pair samples were constrained to fit the mean redshift, r-band luminosity, stellar mass, and light concentration parameter of the observed void galaxy pairs. We find that optical colors show pair members in voids to be significantly bluer than the corresponding pair members residing in the wall and field. This difference does not depend strongly on galaxy stellar mass, concentration, or r-band luminosity. WISE mid-IR photometry for a subsample of pairs in the three environments offered the opportunity to study the remission by the dusty environment associated with star forming regions in galaxies. We obtained significantly larger w1 − w2 and w2 − w3 values for the void pair members with respect to the corresponding matched samples in the wall and in field environments. Through contrast with optical colors, we found that the mid-IR photometry shows a dependence on both stellar mass and the concentration parameter. We observed larger differences for a high mass and concentration. We also noticed that the mid-IR color-color diagram shows void pair members consistent with star forming galaxies, in contrast with the other environments that exhibit a bimodal behavior of passive and star forming objects. This fact reflects a large star formation activity in pairs residing in cosmic voids. The stellar population age parameter, Dn(4000), showed a significantly younger population associated with pair members in voids in line with the findings for the mid-IR colors. This is also reflected in the higher star formation efficiency, SFR/M*, values, which show a greater efficiency for pairs residing in voids. We also noticed that the star formation efficiency is greater for luminous pair members in cosmic voids. The lack of a significant star formation activity enhancement in the faint members may originate from the fact that these galaxies are intrinsically more unstable and less suited to the generation of new stars, which makes the pairs more difficult to distinguish in the different environments.
In addition, we observed a deficit in the distribution of field paired galaxies at log(Mstar/Msun) ≈ 9.5 (Figs. 3a, 3c, 9a and 10a). We note that this is not a sample selection effect as seen in the third panel of Fig. 1, where the distribution of log(Mstar/Msun) shows no feature at this mass threshold, and that no cut was imposed in stellar mass. We argue that this deficit is an effect of the galaxy interaction, which can cause star formation truncation in a low-mass companion. Thus, a very low-mass companion is likely to experience suppression of star formation, so the gap could be a reflection of this effect, which would move otherwise star forming galaxies of very low stellar mass onto the passive sequence and produce a gap at an intermediate mass range log(Mstar/Msun) ∼ 9.5.
We stress that rather than the global environment, local effects more strongly influence the results of low-mass interacting galaxies. This suggests that the distribution of stellar population, star formation histories, dust, and the gas content of paired galaxies are similar and dominate through the astrophysics of interactions. However, more massive interacting galaxies may be most affected by accretion from the global environment. This may be related to the stellar mass threshold at log(Mstar/Msun) ∼ 10.5 for the tight star forming main sequence measured in the Illustris simulation (Donnari et al. 2019). In fact, in our analysis, the specific star formation rate to stellar mass relation at the high mass end differs considerably in void and field environments. This adds to previous discussions on the observed average specific star formation rate versus stellar mass relation given in Salim et al. (2007).
A comparison between pair members and non-interacting galaxies showed a soft tendency to have bluer optical colors and greater star formation rates, but this weak effect is not as clearly evident as in the comparison between the pair populations. Globally speaking, we also find that the global specific star formation rate associated with galaxy interactions is significantly greater in cosmic void pairs. This greater star formation activity could be associated with both the richer gas environment and the expected gentler behavior as compared to the more eccentric orbital dynamics and the strong interactions and mergers more likely to have taken place in the wall and field environments.
Data availability
The data underlying this article will be available upon reasonable request to the corresponding author. Paired galaxies in cosmic voids are available on https://doi.org/10.5281/zenodo.15540844
C = r90/r50 is the ratio of Petrosian 90%–50% r-band light radii.
Acknowledgments
This work has been partially supported by Consejo de Investigaciones Científicas y Técnicas de la República Argentina (CONICET), the Secretaría de Ciencia y Técnica de la Universidad Nacional de Córdoba (SeCyT) and Secretaría de Ciencia y Técnica de la Universidad Nacional de San Juan. Funding for the SDSS and SDSS-II has been provided by the Alfred P. Sloan Foundation, the Participating Institutions, the National Science Foundation, the U.S. Department of Energy, the National Aeronautics and Space Administration, the Japanese Monbukagakusho, the Max Planck Society, and the Higher Education Funding Council for England. The SDSS Web Site is http://www.sdss.org/. The SDSS is managed by the Astrophysical Research Consortium for the Participating Institutions. The Participating Institutions are the American Museum of Natural History, Astrophysical Institute Potsdam, University of Basel, University of Cambridge, Case Western Reserve University, University of Chicago, Drexel University, Fermilab, the Institute for Advanced Study, the Japan Participation Group, Johns Hopkins University, the Joint Institute for Nuclear Astrophysics, the Kavli Institute for Particle Astrophysics and Cosmology, the Korean Scientist Group, the Chinese Academy of Sciences (LAMOST), Los Alamos National Laboratory, the Max-Planck-Institute for Astronomy (MPIA), the Max-Planck-Institute for Astrophysics (MPA), New Mexico State University, Ohio State University, University of Pittsburgh, University of Portsmouth, Princeton University, the United States Naval Observatory, and the University of Washington. This research has used the NASA’s Astrophysics Data System. Plots were performed using R software.
References
- Alonso, M., Lambas, D. G., Tissera, P., & Coldwell, G. 2006, MNRAS, 367, 1029 [Google Scholar]
- Alonso, M. S., Lambas, D. G., Tissera, P., & Coldwell, G. 2007, MNRAS, 375, 1017 [NASA ADS] [CrossRef] [Google Scholar]
- Alonso, S., Mesa, V., Padilla, N., & Lambas, D. G. 2012, A&A, 539, A46 [NASA ADS] [CrossRef] [EDP Sciences] [Google Scholar]
- Amiri, A., Tavasoli, S., & De Zotti, G. 2019, ApJ, 874, 140 [NASA ADS] [CrossRef] [Google Scholar]
- Baldry, I. K., Balogh, M. L., Bower, R., Glazebrook, K., & Nichol, R. C. 2004, AIP Conf. Ser., 743, 106 [Google Scholar]
- Balogh, M. L., Morris, S. L., Yee, H. K. C., Carlberg, R. G., & Ellingson, E. 1999, ApJ, 527, 54 [Google Scholar]
- Barnes, J. E., & Hernquist, L. 1992, ARA&A, 30, 705 [Google Scholar]
- Barnes, J. E., & Hernquist, L. 1996, ApJ, 471, 115 [NASA ADS] [CrossRef] [Google Scholar]
- Barton, E. J., Geller, M. J., & Kenyon, S. J. 2000, ApJ, 530, 660 [NASA ADS] [CrossRef] [Google Scholar]
- Barton, E. J., Arnold, J. A., Zentner, A. R., Bullock, J. S., & Wechsler, R. H. 2007, ApJ, 671, 1538 [Google Scholar]
- Benavides, J. A., Sales, L. V., & Abadi, M. G. 2020, MNRAS, 498, 3852 [Google Scholar]
- Beygu, B., Kreckel, K., van der Hulst, J. M., et al. 2016, MNRAS, 458, 394 [NASA ADS] [CrossRef] [Google Scholar]
- Beygu, B., Peletier, R. F., van der Hulst, J. M., et al. 2017, MNRAS, 464, 666 [NASA ADS] [CrossRef] [Google Scholar]
- Blanton, M. R., & Roweis, S. 2007, AJ, 133, 734 [NASA ADS] [CrossRef] [Google Scholar]
- Blanton, M. R., Bershady, M. A., Abolfathi, B., et al. 2017, AJ, 154, 28 [Google Scholar]
- Bournaud, F. 2010, ASP Conf. Ser., 423, 177 [NASA ADS] [Google Scholar]
- Brinchmann, J., Charlot, S., White, S. D. M., et al. 2004, MNRAS, 351, 1151 [Google Scholar]
- Bundy, K., Scarlata, C., Carollo, C. M., et al. 2010, ApJ, 719, 1969 [NASA ADS] [CrossRef] [Google Scholar]
- Ceccarelli, L., Padilla, N. D., Valotto, C., & Lambas, D. G. 2006, MNRAS, 373, 1440 [NASA ADS] [CrossRef] [Google Scholar]
- Ceccarelli, L., Padilla, N., & Lambas, D. G. 2008, MNRAS, 390, L9 [NASA ADS] [Google Scholar]
- Ceccarelli, L., Herrera-Camus, R., Lambas, D. G., Galaz, G., & Padilla, N. D. 2012, MNRAS, 426, L6 [Google Scholar]
- Ceccarelli, L., Paz, D., Lares, M., Padilla, N., & Lambas, D. G. 2013, MNRAS, 434, 1435 [NASA ADS] [CrossRef] [Google Scholar]
- Ceccarelli, L., Duplancic, F., & Garcia Lambas, D. 2022, MNRAS, 509, 1805 [Google Scholar]
- Constantin, A., Hoyle, F., & Vogeley, M. S. 2008, ApJ, 673, 715 [NASA ADS] [CrossRef] [Google Scholar]
- Correa, C. M., Paz, D. J., Padilla, N. D., et al. 2022, MNRAS, 509, 1871 [Google Scholar]
- Courtois, H. M., van de Weygaert, R., Aubert, M., et al. 2023, A&A, 673, A38 [NASA ADS] [CrossRef] [EDP Sciences] [Google Scholar]
- Cucciati, O., Iovino, A., Kovač, K., et al. 2010, A&A, 524, A2 [NASA ADS] [CrossRef] [EDP Sciences] [Google Scholar]
- Darg, D. W., Kaviraj, S., Lintott, C. J., et al. 2010, MNRAS, 401, 1043 [NASA ADS] [CrossRef] [Google Scholar]
- Das, A., Pandey, B., Sarkar, S., & Dutta, A. 2021, ArXiv e-prints [arXiv:2108.05874] [Google Scholar]
- de Ravel, L., Kampczyk, P., Le Fèvre, O., et al. 2011, ArXiv e-prints [arXiv:1104.5470] [Google Scholar]
- Deger, S., Rudnick, G., Kelkar, K., et al. 2018, ApJ, 869, 6 [Google Scholar]
- Domínguez-Gómez, J., Pérez, I., Ruiz-Lara, T., et al. 2023, Nature, 619, 269 [CrossRef] [Google Scholar]
- Donnari, M., Pillepich, A., Nelson, D., et al. 2019, MNRAS, 485, 4817 [Google Scholar]
- Dotti, M., Sesana, A., & Decarli, R. 2012, Adv. Astron., 2012, 940568 [CrossRef] [Google Scholar]
- Ellison, S. L., Patton, D. R., Simard, L., et al. 2010, MNRAS, 407, 1514 [NASA ADS] [CrossRef] [Google Scholar]
- Ellison, S. L., Viswanathan, A., Patton, D. R., et al. 2019, MNRAS, 487, 2491 [NASA ADS] [CrossRef] [Google Scholar]
- Fernandez, J., Alonso, S., Mesa, V., & Duplancic, F. 2024, A&A, 683, A32 [NASA ADS] [CrossRef] [EDP Sciences] [Google Scholar]
- Gallazzi, A., Charlot, S., Brinchmann, J., White, S. D. M., & Tremonti, C. A. 2005, MNRAS, 362, 41 [Google Scholar]
- García-Benito, R., Jiménez, A., Sánchez-Menguiano, L., et al. 2024, A&A, 691, A161 [NASA ADS] [CrossRef] [EDP Sciences] [Google Scholar]
- Grogin, N. A., & Geller, M. J. 2000, AJ, 119, 32 [NASA ADS] [CrossRef] [Google Scholar]
- Hamaus, N., Sutter, P. M., Lavaux, G., & Wandelt, B. D. 2015, JCAP, 2015, 036 [Google Scholar]
- Jarrett, T. H., Cluver, M. E., Magoulas, C., et al. 2017, ApJ, 836, 182 [Google Scholar]
- Jian, H.-Y., Lin, L., & Chiueh, T. 2012, ApJ, 754, 26 [NASA ADS] [CrossRef] [Google Scholar]
- Kampczyk, P., Lilly, S. J., de Ravel, L., et al. 2013, ApJ, 762, 43 [NASA ADS] [CrossRef] [Google Scholar]
- Kauffmann, G., Heckman, T. M., White, S. D. M., et al. 2003, MNRAS, 341, 33 [Google Scholar]
- Kennicutt, R. C. 1998, ARA&A, 36, 189 [NASA ADS] [CrossRef] [Google Scholar]
- Kreckel, K., Platen, E., Aragón-Calvo, M. A., et al. 2011, AJ, 141, 4 [NASA ADS] [CrossRef] [Google Scholar]
- Lambas, D. G., Tissera, P. B., Alonso, M. S., & Coldwell, G. 2003, MNRAS, 346, 1189 [NASA ADS] [CrossRef] [Google Scholar]
- Lambas, D. G., Alonso, S., Mesa, V., & O’Mill, A. L. 2012, A&A, 539, A45 [NASA ADS] [CrossRef] [EDP Sciences] [Google Scholar]
- Lin, L., Cooper, M. C., Jian, H.-Y., et al. 2010, ApJ, 718, 1158 [NASA ADS] [CrossRef] [Google Scholar]
- Liu, C.-X., Pan, D. C., Hao, L., et al. 2015, ApJ, 810, 165 [NASA ADS] [CrossRef] [Google Scholar]
- Martinet, L. 1995, Fund. Cosmic Phys., 15, 341 [NASA ADS] [Google Scholar]
- McIntosh, D. H., Guo, Y., Hertzberg, J., et al. 2008, MNRAS, 388, 1537 [NASA ADS] [CrossRef] [Google Scholar]
- Mesa, V., Duplancic, F., Alonso, S., Coldwell, G., & Lambas, D. G. 2014, MNRAS, 438, 1784 [CrossRef] [Google Scholar]
- Mesa, V., Duplancic, F., Alonso, S., et al. 2018, A&A, 619, A24 [NASA ADS] [CrossRef] [EDP Sciences] [Google Scholar]
- Mihos, J. C., & Hernquist, L. 1996, ApJ, 464, 641 [Google Scholar]
- Moorman, C. M., Moreno, J., White, A., et al. 2016, ApJ, 831, 118 [NASA ADS] [CrossRef] [Google Scholar]
- Padilla, N. D., Ceccarelli, L., & Lambas, D. G. 2005, MNRAS, 363, 977 [Google Scholar]
- Pan, D. C., Vogeley, M. S., Hoyle, F., Choi, Y.-Y., & Park, C. 2012, MNRAS, 421, 926 [NASA ADS] [CrossRef] [Google Scholar]
- Park, C., Choi, Y.-Y., Vogeley, M. S., et al. 2007, ApJ, 658, 898 [Google Scholar]
- Paz, D., Lares, M., Ceccarelli, L., Padilla, N., & Lambas, D. G. 2013, MNRAS, 436, 3480 [NASA ADS] [CrossRef] [Google Scholar]
- Pearson, W. J., Wang, L., Alpaslan, M., et al. 2019, A&A, 631, A51 [NASA ADS] [CrossRef] [EDP Sciences] [Google Scholar]
- Pearson, W. J., Suelves, L. E., Ho, S. C. C., et al. 2022, A&A, 661, A52 [NASA ADS] [CrossRef] [EDP Sciences] [Google Scholar]
- Perez, J., Tissera, P., & Blaizot, J. 2009a, MNRAS, 397, 748 [NASA ADS] [CrossRef] [Google Scholar]
- Perez, J., Tissera, P., Padilla, N., Alonso, M. S., & Lambas, D. G. 2009b, MNRAS, 399, 1157 [NASA ADS] [CrossRef] [Google Scholar]
- Pérez, I., Verley, S., Sánchez-Menguiano, L., et al. 2024, A&A, 689, A213 [NASA ADS] [CrossRef] [EDP Sciences] [Google Scholar]
- Ricciardelli, E., Cava, A., Varela, J., & Quilis, V. 2014, MNRAS, 445, 4045 [NASA ADS] [CrossRef] [Google Scholar]
- Ricciardelli, E., Cava, A., Varela, J., & Tamone, A. 2017, ApJ, 846, L4 [NASA ADS] [CrossRef] [Google Scholar]
- Rodríguez-Medrano, A. M., Paz, D. J., Stasyszyn, F. A., et al. 2023, MNRAS, 521, 916 [CrossRef] [Google Scholar]
- Salim, S., Rich, R. M., Charlot, S., et al. 2007, ApJS, 173, 267 [NASA ADS] [CrossRef] [Google Scholar]
- Sandage, A., & Visvanathan, N. 1978, ApJ, 225, 742 [NASA ADS] [CrossRef] [Google Scholar]
- Skibba, R. A., Bamford, S. P., Nichol, R. C., et al. 2009, MNRAS, 399, 966 [NASA ADS] [CrossRef] [Google Scholar]
- Strateva, I., Ivezić, Ž., Knapp, G. R., et al. 2001, AJ, 122, 1861 [CrossRef] [Google Scholar]
- Strauss, M. A., Weinberg, D. H., Lupton, R. H., et al. 2002, AJ, 124, 1810 [Google Scholar]
- Sureshkumar, U., Durkalec, A., Pollo, A., et al. 2024, A&A, 686, A40 [NASA ADS] [CrossRef] [EDP Sciences] [Google Scholar]
- Tonnesen, S., & Cen, R. 2012, MNRAS, 425, 2313 [Google Scholar]
- Toomre, A., & Toomre, J. 1972, ApJ, 178, 623 [Google Scholar]
- Tran, K.-V. H., Moustakas, J., Gonzalez, A. H., et al. 2008, ApJ, 683, L17 [NASA ADS] [CrossRef] [Google Scholar]
- Vera, M., Alonso, S., & Coldwell, G. 2016, A&A, 595, A63 [NASA ADS] [CrossRef] [EDP Sciences] [Google Scholar]
- von Benda-Beckmann, A. M., & Müller, V. 2008, MNRAS, 384, 1189 [CrossRef] [Google Scholar]
- Woods, D. F., & Geller, M. J. 2007, AJ, 134, 527 [NASA ADS] [CrossRef] [Google Scholar]
- Wright, E. L., Eisenhardt, P. R. M., Mainzer, A. K., et al. 2010, AJ, 140, 1868 [Google Scholar]
- Yamauchi, C., Ichikawa, S.-I., Doi, M., et al. 2005, AJ, 130, 1545 [Google Scholar]
- York, D. G., Adelman, J., Anderson, J. E., et al. 2000, AJ, 120, 1579 [Google Scholar]
All Tables
Restrictions and numbers of total galaxy pairs and matched pairs in the different regions.
Percentage of paired galaxies with blue colors located in the void interior environment and for matched samples of pairs in void walls and fields. Standard errors are included.
Percentages of paired galaxies having w2 − w3 > 2.5 selected according to mass and concentration located in the void interior environment, void walls, and field. Standard errors are included.
Percentages of paired galaxies with efficient star formation activity and young stellar populations located in the void environment and for matched samples of pairs in walls and fields. Standard errors are included.
Percentages of paired galaxies that have efficient star formation and a young stellar population selected according to star mass and concentration in the void interior, void walls, and field. Standard errors are included.
All Figures
|
Fig. 1. Normalized distributions of redshift, r-band absolute magnitude, stellar masses, and concentration parameter for pair galaxies in voids (blue solid lines), in wall (green dashed lines), and in fields (shaded histograms). |
| In the text | |
|
Fig. 2. Distributions of u − r and g − r for pair galaxies in voids (blue solid lines), in wall (green dashed lines), and in fields (shaded histograms). |
| In the text | |
|
Fig. 3. Study of stellar mass and concentration impact on color void paired galaxies. (a) Central panel: Scatter plot of u − r as a function of log(M*/Msun) for pair galaxies in voids (blue), in wall (green), and in fields (black). Diamonds and solid lines indicate the median. The vertical dotted line represents log(M*/Msun)=9.5. Left panel: Normalized distribution of g − r for log(M*/Msun)< 9.5 paired galaxies in voids and field. Right panel: Same as in the left panel but for log(M*/Msun)> 9.5. (b) Central panel: Scatter plot of u − r as a function of concentration index for pair galaxies in voids (blue), in wall (green) and in fields (black). Diamonds and solid lines indicate the median. Left panel: Normalized distribution of g − r for C < 2.5 paired galaxies in voids and field. Right panel: Same as in the left panel but for C > 2.5. (c) Central panel: Scatter plot of g − r as a function of log(M*/Msun) for pair galaxies in voids (blue), in wall (green), and in fields (black). Diamonds and solid lines indicate the median. The vertical dotted line represents log(M*/Msun)=9.5. Left panel: Normalized distribution of g − r for log(M*/Msun)< 9.5 paired galaxies in voids and field. Right panel: Same as in the left panel but for log(M*/Msun)> 9.5. (d) Central panel: Scatter plot of g − r as a function of concentration index for pair galaxies in voids (blue), in wall (green), and in fields (black). Diamonds and solid lines indicate the median. Left panel: Normalized distribution of g − r for C < 2.5 paired galaxies in voids and field. Right panel: Same as in the left panel but for C > 2.5. |
| In the text | |
|
Fig. 4. Color magnitude diagrams: u − r (upper panel) and g − r (bottom panel) as a function of Mr for pair galaxies located in voids (blue points), in wall (green points), and in fields (black contours). Connected diamonds indicate the median values. |
| In the text | |
|
Fig. 5. Distributions of w1 − w2 and w2 − w3 for pair galaxies in voids (blue solid lines), in the wall (green dashed lines) and, in fields (shaded histograms). |
| In the text | |
|
Fig. 6. WISE color-color diagrams for pair galaxies located in voids (right panel, blue contours), in the wall (central panel, green contours), and in fields (left panel, gray). |
| In the text | |
|
Fig. 7. Study of stellar mass and concentration impact on infrared color for void paired galaxies. (a) Central panel: Scatter plot of w2 − w3 as a function of log(M*/Msun) for pair galaxies in voids (blue), in wall (green), and in fields (black). Diamonds and solid lines indicate the median. The vertical dotted line represents log(M*/Msun)=9.5. Left panel: Normalized distribution of g − r for log(M*/Msun)< 9.5 paired galaxies in voids and field. Right panel: Same as in the left panel but for log(M*/Msun)> 9.5. (b) Central panel: Scatter plot of w2 − w3 as a function of concentration index for pair galaxies in voids (blue), in wall (green) and in fields (black). Diamonds and solid lines indicate the median. Left panel: Normalized distribution of g − r for C < 2.5 paired galaxies in voids and field. Right panel: Same as in the left panel but for C > 2.5. |
| In the text | |
|
Fig. 8. Distributions of log(SFR/M*) and Dn(4000) for pair galaxies in the void interiors (blue solid lines), in void walls (green dashed lines), and in fields (shaded histograms). |
| In the text | |
|
Fig. 9. Study of stellar mass and concentration impact on age of stellar population for void paired galaxies. (a) Central panel: Scatter plot of Dn(4000) as a function of log(M*/Msun) for pair galaxies in the void interiors (blue), in void walls (green), and in the field (black). Diamonds and solid lines indicate the median. The vertical dotted line represents log(M*/Msun)=9.5. Left panel: Dn(4000) normalized distribution for log(M*/Msun)< 9.5 paired galaxies in voids and the field. Right panel: Same as in the left panel but for log(M*/Msun)> 9.5. (b) Central panel: Scatter plot of Dn(4000) as a function of concentration index for pair galaxies in the void interiors (blue), in void walls (green), and in the field (black). Diamonds and solid lines indicate the median. The vertical dotted line represents C = 2.5. Left panel: Dn(4000) normalized distribution for C < 2.5 paired galaxies in voids and field. Right panel: Same as in the left panel but for C > 2.5. |
| In the text | |
|
Fig. 10. Study of stellar mass and concentration impact on star formation activity for void paired galaxies. (a) Central panel: Scatter plot of log(SFR/M*) as a function of log(M*/Msun) for pair galaxies in the void interiors (blue), in void walls (green), and in the field (black). Diamonds and solid lines indicate the median. The vertical dotted line represents log(M*/Msun)=9.5. Left panel: log(SFR/M*) normalized distribution for log(M*/Msun)< 9.5 paired galaxies in voids and field. Right panel: Same as in the left panel but for log(M*/Msun)> 9.5. (b) Analogous to panel a but for non-interacting galaxies. (c) Central panel: Scatter plot of log(SFR/M*) as a function of C for pair galaxies in the void interiors (blue), in void walls (green), and in the field (black). Diamonds and solid lines indicate the median. The vertical dotted line represents C= 2.5. Left panel: log(SFR/M*) normalized distribution for C < 2.5 paired galaxies in voids and field. Right panel: Same as in the left panel but for C > 2.5. (d) Analogous to panel c but for non-interacting galaxies. |
| In the text | |
|
Fig. 11. Upper panel: Global specific star formation rate in void regions and the field for paired and non-interacting galaxies. Shaded regions correspond to standard errors. Lower panel: Number of galaxies in the volume-complete samples. |
| In the text | |
Current usage metrics show cumulative count of Article Views (full-text article views including HTML views, PDF and ePub downloads, according to the available data) and Abstracts Views on Vision4Press platform.
Data correspond to usage on the plateform after 2015. The current usage metrics is available 48-96 hours after online publication and is updated daily on week days.
Initial download of the metrics may take a while.