Fig. 1.
Download original image
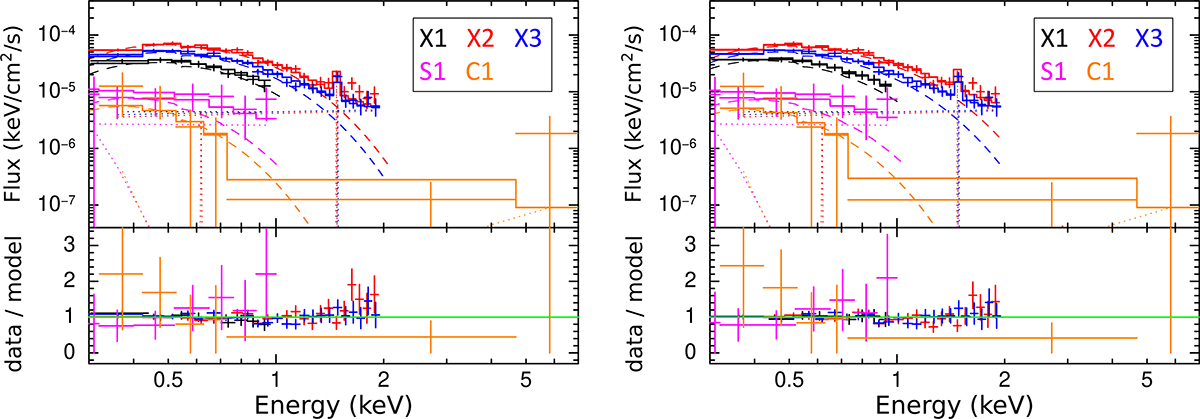
Left: Joint fit of the J1231 data at five epochs (colour–coded) using the fit function constant*TBabs*slimdz. The EPIC MOS data are excluded for plot clarity only. The solid, dashed, and dotted lines represent the total model, the slim disc, and the background components, respectively. The bottom panel shows the ratio between observed counts per spectral bin (data) and the predicted counts from the best-fit model (solid lines in the top panel). The spectral evolution is well explained by a slim disc with only its ṁ varying between epochs (Table D.1). Right: Same as the left plot, but here the spectral evolution across the three XMM-Newton epochs is explained by a varying θ while the ṁ remains constant.
Current usage metrics show cumulative count of Article Views (full-text article views including HTML views, PDF and ePub downloads, according to the available data) and Abstracts Views on Vision4Press platform.
Data correspond to usage on the plateform after 2015. The current usage metrics is available 48-96 hours after online publication and is updated daily on week days.
Initial download of the metrics may take a while.