| Issue |
A&A
Volume 700, August 2025
|
|
|---|---|---|
| Article Number | A48 | |
| Number of page(s) | 13 | |
| Section | Extragalactic astronomy | |
| DOI | https://doi.org/10.1051/0004-6361/202453423 | |
| Published online | 04 August 2025 | |
The intermediate–mass black hole 2XMM J123103.2+110648: A varying disc accretion rate during possible X–ray quasi–periodic eruptions?
1
SRON, Netherlands Institute for Space Research, Niels Bohrweg 4, 2333 CA Leiden, The Netherlands
2
Department of Astrophysics/IMAPP, Radboud University, P.O. Box 9010 6500 GL Nijmegen, The Netherlands
3
National Astronomical Observatories, Chinese Academy of Sciences, 20A Datun Road, Beijing 100101, China
4
Department of Astronomy, University of Wisconsin, Madison, WI 53706, USA
5
Racah Institute of Physics, The Hebrew University, Jerusalem 91904, Israel
6
The University of Arizona, 933 N. Cherry Ave., Tucson, AZ 85721, USA
⋆ Corresponding author: This email address is being protected from spambots. You need JavaScript enabled to view it.
Received:
12
December
2024
Accepted:
8
June
2025
Abstract
We fit the evolving X-ray spectra of the variable and fading source 2XMM J123103.2+110648 (J1231), which is an intermediate-mass black hole (IMBH) candidate. Recent X-ray timing studies propose that the quasi–periodic oscillation (QPO) of J1231, observed at the peak of its X-ray light curve, is a variant of the quasi-periodic eruptions (QPEs) observed in other sources. Here, we fit X–ray spectra from XMM-Newton, Swift, and Chandra using a slim disc model for the black hole accretion disc, obtaining a best-fit black hole mass of (6 ± 3)×104 M⊙ and a spin of > 0.6 at 2σ confidence. This mass is consistent with previous estimates, supporting the IMBH interpretation, and the spin measurement is new. Yet, the nature of J1231 remains uncertain: its long-term variability (decade-long continuum evolution) could signal a tidal disruption event or active galactic nucleus variability. We find that the spectral evolution within the first three years after the source’s detection can be well explained by either a varying disc accretion rate, ṁ, or a varying disc inclination, θ. Meanwhile, we find that during the short-term variability (the QPO with a ∼3.8 h period), each oscillation does not show the ‘hard-rise-soft-decay’ typical of QPEs. We fit the average spectrum at the QPO light curve maxima and the average spectrum at its minima, finding that the spectral difference is well explained by ṁ decreasing from peaks to valleys if θ < 30° and remaining constant between all data epochs. This result suggests that the short–term QPO behaviour might also be driven by a varying disc ṁ.
Key words: accretion / accretion disks / black hole physics
© The Authors 2025
 Open Access article, published by EDP Sciences, under the terms of the Creative Commons Attribution License (https://creativecommons.org/licenses/by/4.0), which permits unrestricted use, distribution, and reproduction in any medium, provided the original work is properly cited.
This article is published in open access under the Subscribe to Open model. This email address is being protected from spambots. You need JavaScript enabled to view it. to support open access publication.
1. Introduction
Intermediate–mass (102–105 M⊙) black holes (IMBHs) are believed to play a vital role in the formation history of supermassive black holes (SMBHs; ≳106 M⊙; e.g. Volonteri 2010; Kormendy & Ho 2013; Natarajan 2014; Shankar et al. 2016; Pacucci et al. 2018; Banados et al. 2018). Measuring the mass and spin distributions of IMBHs can help us to understand the collective formation and evolutionary history of IMBHs and SMBHs (e.g. Greene et al. 2020; Inayoshi et al. 2020). The source 2XMM J123103.2+110648 (J1231; redshift z = 0.11871; Ho et al. 2012) is an accreting IMBH candidate. It was serendipitously discovered in archival XMM-Newton X–ray data (Terashima et al. 2012; Lin et al. 2013b). The source X-ray flux decayed by approximately one order of magnitude between 2006 and 2016 (Lin et al. 2017). Optical data indicate that the source could be an IMBH. The black hole mass is derived using the observed line width by extrapolating the empirical relation between the black hole mass and the velocity dispersion of optical lines from the galaxy (∼1 × 10⁵ M⊙; Ho et al. 2012).
The origin of the changes in J1231’s X-ray emission is unclear. It has been proposed that J1231 is a tidal disruption event (TDE; Lin et al. 2013a, 2017), that is, a star that has approached and then been tidally disrupted by a black hole, leading to the formation of an accretion disc (e.g. Hills 1975; Rees 1988). The behaviour of J1231’s X-ray emission supports this picture: both its sustained high X–ray luminosity for years (> 1041 erg/s between 0.3–10 keV) (e.g. Rees 1988; Maksym et al. 2014; Lin et al. 2017; Wen et al. 2020) and its very soft X–ray (most photons are ≲2 keV) spectra are in line with typical TDE light curves and spectra, which are dominated by disc emission (e.g. Ulmer 1999; Lodato & Rossi 2011; Lin et al. 2013a, 2017; Guolo et al. 2024a).
It is also possible that J1231’s long–term changing emission over the decade arises from active galactic nucleus (AGN) variability. Optical spectra from the host galaxy taken in 2012 indicate the presence of a low–luminosity (g-band: −17.9 mag), type–2 AGN (Ho et al. 2012; Lin et al. 2017), while a TDE–associated origin of the narrow optical lines is not excluded. As discussed by Lin et al. (2017), the observed long–term variability may be due to an AGN disc instability (as proposed for NGC 3599 and IC 3599; e.g. Saxton et al. 2015; Grupe et al. 2015; Inkenhaag et al. 2021).
Also notable is J1231’s X–ray quasi-periodic short-term variability, over a timescale of hours, which is observed during two of the three XMM-Newton epochs. Observations of J1231 were carried out by space observatory XMM-Newton on 2003 July 13, 2005 December 13, and 2005 December 171. In this paper, we label these three epochs as X1, X2, and X3, respectively. Lin et al. (2013a) find X–ray QPOs with a ∼3.8 hour period at X2 and X3, but at X1 the QPO is not detected. Observations approximately ten years later by space observatories Chandra (with instrument Advanced CCD Imaging Spectrometer, or ACIS) and Swift (with X–Ray Telescope, or XRT) do not show such short–term variability, suggesting that the QPO has either turned off or that it has become undetectable due to the diminished source flux (see Table 1 for the estimated flux at each observation epoch). It is possible that J1231’s QPO is related to the low–frequency QPOs (LFQPOs; e.g. Remillard & McClintock 2006) detected in X–ray binaries (XRBs) of stellar–mass black holes, but scaled up to the IMBH mass regime (Lin et al. 2013a). Low-frequency quasi-periodic oscillations (LFQPOs) in X-ray binaries are sometimes attributed to Lense-Thirring precession of a misaligned accretion disc, which would arise naturally in a TDE (Stone & Loeb 2012).
Properties of the archival observations of J1231 used in this work.
Recently, a new form of X–ray variability – quasi–periodic eruptions (QPEs)– has been discovered in several TDEs and AGNs (e.g. Miniutti et al. 2019; Giustini et al. 2020; Arcodia et al. 2021; Chakraborty et al. 2021; Evans et al. 2023; Quintin et al. 2023; Nicholl et al. 2024; Arcodia et al. 2024; Guolo et al. 2024b). While the physical origin of QPEs is actively debated, they are observed as rapid X–ray flares (∼ks) separated by quiescent baselines, differentiated from the gentler, quasi–sinusoidal modulations of standard QPOs. Although the QPOs of J1231 do not show a clear distinction between flares and quiescence, their variability timescales are similar to those of QPEs, leading to the proposal that J1231 is a QPE variant (e.g. Webbe & Young 2023; King 2023). Investigating the physical origin of J1231’s short–term variability could shed light on both mechanisms responsible for X–ray variability and the possible link between J1231 and QPE sources.
In this paper, we fit a decade of evolving J1231 X–ray spectra to constrain the black hole mass and spin with our slim disc model of the accretion disc. As the X–ray timing analysis for X2 and X3 has been performed in previous work (Lin et al. 2013a; Webbe & Young 2023), we focus on spectral analysis here. This paper is structured as follows. In Sect. 2, we describe the data and the data reduction methods. In Sect. 3, we present the results of our analysis. In Sect. 4, we discuss the implications of our results. In Sect. 5, we present our conclusions.
2. Observations and methods
J1231 has been observed in X–rays by several satellites since its outburst began in 2003. In our analysis, we used all the archival X–ray spectroscopic data of J1231 available up to the end of 2024. A summary of the data used is given in Table 1. The details of the data reduction process are presented in the appendix.
We carried out spectral analysis using the XSPEC package (Arnaud 1996) version 12.14.0. For consistency, we created a logarithmic energy array of 1000 bins from 0.1 to 100.0 keV for model calculations in all analyses (ENERGIES command in XSPEC). When fitting models to data, we evaluated the goodness–of–fit using Poisson statistics (Cash 1979; C-STAT in XSPEC), due to the low photon counts (< 100) in some of the spectra. We calculated the expected value of the C-statistic, Ce, and its root–mean–square (RMS), based on the polynomial expressions given by Kaastra (2017). We rebinned each background and source+background spectrum using the optimal–binning algorithm (Kaastra & Bleeker 2016, implemented using the FTOOL FTGROUPPHA), while requiring the spectra to have a minimum of one count per bin (with the sc grouptype parameter set to optmin). For each spectrum, we discarded the data bins where the background count rate was higher than the source count rate. The energy range in each spectrum that remained after this filtering is listed in Table 1 for each observation. Unless otherwise stated, we quote all parameter errors at the 1σ (68%) confidence level, corresponding to ΔC-stat = 1.0 and ΔC-stat = 2.3 for single– and two–parameter error estimates, respectively.
We first fitted the background spectrum. The background fit function was phenomenological and consisted of up to two Gaussian components and one to three power–law components (depending on the instrument). The full width at half maximum (FWHM) of each background Gaussian component was fixed to σGauss = 0.001 keV; this is less than the spectral resolution of all instruments considered in this paper. This phenomenological background model accounted for both a background continuum and possible fluorescence lines (e.g. Katayama et al. 2004; Pagani et al. 2007; Harrison et al. 2010). Next, we added the best–fit background model to the fit function describing the source+background spectrum. The background model parameters were kept fixed at the best–fit values determined from the fit to the background–only spectrum. In this paper, when studying the source+background spectra, we refer to the part of the fit function that describes the source as the ‘fit function’.
In the spectral analysis, we included the Galactic absorption in the fit function through the XSPEC model TBabs (Wilms et al. 2000). We fixed the column density NH of TBabs to 2.6 × 1020 cm−2, which is slightly larger than the NH value used in previous studies (∼2.3 × 1020 cm−2; e.g. Lin et al. 2017; Webbe & Young 2023) derived from the density of atomic hydrogen from 21 cm survey data (Kalberla et al. 2005). The new NH = 2.6 × 1020 cm−2 was derived by mapping Galactic absorption using the X–ray afterglows of γ–ray bursts (Willingale et al. 2013), taking into account hydrogen in both atomic and molecular form2. We present the tables of fit parameter constraints in the appendix.
3. Results
3.1. Low black hole mass and high spin from slim disc modelling
We fitted the accretion disc spectra of J1231 using the slim disc model slimdz (Wen et al. 2020, 2022), as its X–ray luminosity is close to the Eddington limit, where disc advection cannot be neglected. The slim disc model considers the stationary, relativistic ‘slim disc’ accretion disc solutions (Abramowicz et al. 1988) and it ray–traces the disc photons self–consistently into the observer’s frame. The model implements the astrophysical spin limit of a Kerr black hole, −0.998 < a• < 0.998 (Thorne 1974). In the slimdz model, the disc radiative efficiency, η, is fixed to 0.1 solely to determine the unit of the mass accretion rate: ṁEdd = 1.37 × 10²¹ kg s−1(0.1/η)(M•/106 M⊙). The actual disc radiative efficiency can vary between epochs (as expected in the slim–disc scenario when the ṁ changes; e.g. Abramowicz & Fragile 2013), and can be determined from the physical value of ṁ after constraining the mass M• and spin a•. Further details of slimdz, including the assumption of a fixed viscosity α = 0.1, are presented in Wen et al. 2022. Comparisons of the slimdz model with other thin disc models (e.g. optxagnf; Done et al. 2012) have been made (e.g. Cao et al. 2023).
We note that slimdz was originally designed for TDE sources in that it assumes an outer disc radius Rout ≤ 600 Rg (Wen et al. 2022). However, even if J1231 is a variable AGN and not a TDE, the disc region ≥600 Rg of a much larger (> 103Rg) AGN slim disc would contribute little to the X–ray spectrum (≲1%; Wen et al. 2021) at M• ∼ 103–106 M⊙. Therefore, the spectral fits with slimdz are physically self–consistent, regardless of whether J1231 is a TDE.
We fitted all epochs from X1 to C1 together using a fit function ‘constant*TBabs*slimdz’. As we found no evidence for significant intrinsic absorption from our phenomenological fits (summarised in the appendix), we did not include intrinsic absorption in our analysis. First, we assumed that the black hole mass M•, spin a•, and inclination θ remained constant over the ≈13 yr period during which the data were taken. For this joint fit (in which we simultaneously fitted spectra from all epochs), we left these parameters free to vary in the fit but required them to remain constant across epochs. Due to the low number of photons detected at S1 and C1, we could not constrain the renormalisation factor between EPIC pn and Swift XRT (CXRT), or between EPIC pn and Chandra ACIS (CACIS), when ṁ in the slimdz model was left as a free parameter at these epochs. Therefore, we left ṁ as a free parameter in the fit, while fixing both CXRT and CACIS to unity during the joint fit. Through this, we effectively assumed that the different instruments were perfectly cross–calibrated (while in reality the estimated uncertainties are ≲0.5% for CXRT and ≲10% for CACIS; e.g. Plucinsky et al. 2017).
We present the best joint–fit results in Table D.1 and Fig. 1. The long–term X–ray evolution of J1231, i.e. the decade–long decay, can be explained by variations in the mass accretion rate ṁ through the disc. Specifically, ṁ increases from ∼ 0.4 ṁEdd at X1 to ∼ ṁEdd at X2 and X3, before decreasing to ∼ 0.1 ṁEdd at later epochs. Figure 2 summarises the long–term evolution of the disc 0.3–2.0 keV luminosity, as well as ṁ, based on the results of our analysis. Figure 3 shows the ΔC-stat contours in {M•, a•} space, where the BH mass is constrained to be (6 ± 3)×104 M⊙ and the spin to be > 0.6 at 2σ (97.8% single–sided for the spin) confidence. We note that the errors are for two–parameter error estimates accounting for dependencies between the constraints of M• and a•, rather than the single–parameter error estimates in Table D.1.
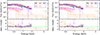 |
Fig. 1. Left: Joint fit of the J1231 data at five epochs (colour–coded) using the fit function constant*TBabs*slimdz. The EPIC MOS data are excluded for plot clarity only. The solid, dashed, and dotted lines represent the total model, the slim disc, and the background components, respectively. The bottom panel shows the ratio between observed counts per spectral bin (data) and the predicted counts from the best-fit model (solid lines in the top panel). The spectral evolution is well explained by a slim disc with only its ṁ varying between epochs (Table D.1). Right: Same as the left plot, but here the spectral evolution across the three XMM-Newton epochs is explained by a varying θ while the ṁ remains constant. |
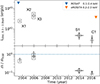 |
Fig. 2. Top panel: Disc luminosity in the 0.3–2.0 keV band versus time as derived from our spectral analysis assuming no disc inclination changes between epochs (Table D.1). The square, diamond, and triangle symbols represent the XMM-Newton, Swift, and Chandra observations, respectively. Upper limits from the ROSAT and eROSITA surveys are also shown (time-shifted for plotting clarity; Voges et al. 1999; Tubín-Arenas et al. 2024). Bottom panel: Fitted disc mass accretion rate ṁ for each epoch, normalised by the Eddington-limited accretion rate (computed assuming a black hole mass of 5.7 × 10⁴ M⊙). The dashed line indicates trans-Eddington accretion. |
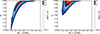 |
Fig. 3. Constraints on M• and a• from the slim disc model fit to the spectra obtained at all observing epochs. We calculate the ΔC-stat across the {M•, a•} plane with respect to the best–fit value (yellow marker) from Table D.1 (left) and from Table D.2 (right). Areas within the 1σ and 2σ confidence limits for two–parameter error estimates are shown in red and blue, respectively. Considering both scenarios, M• is constrained to be (6 ± 3)×104 M⊙ at the 2σ level for the two-parameter fits. The lower limit on the black hole spin is constrained to be > 0.6 at the 2σ (97.8%) single–sided confidence level. |
We also tested whether the luminosity increase from X1 to X2 could be explained by a varying disc inclination θ, rather than ṁ variation. In this scenario, a TDE disc is initially misaligned to the black hole equatorial plane. It can take ∼103 days before the disc is eventually aligned to the black hole equatorial plane (e.g. Franchini et al. 2016). Therefore, in this test fit we assumed that θ at the X1, X2, and X3 epochs was free to vary from one epoch to another. At S1 and C1, ≳10 yr after the first detection, we assumed that disc alignment was terminated and θ remained the same between these two epochs, while this late–time θ was also a free parameter in the fit–function, since the θ of the aligned disc can differ from that of a disc during the alignment process at earlier epochs.
We find that the spectral evolution from X1 to X3 is well explained by a disc with a fixed ṁ and a varying θ (Table D.2). Allowing ṁ to vary between X1, X2, and X3 does not significantly improve the fit, with the C-stat decreasing from 119.0 for 123 degrees of freedom to 118.0 for 121 degrees of freedom. In this joint fit, although the marginal confidence ranges of θ at X1, X2, and X3 overlap, we confirm that for any given set of {ṁ, M•, a•}, the θ values from X1 to X3 differ sufficiently to account for the spectral differences. In Fig. 3, we also present the ΔC-stat contours in {M•, a•} space derived from this joint fit, to compare with results from the previous joint fit with varying ṁ between X1, X2, and X3. Here, the black hole mass was constrained to be (5 ± 2)×104 M⊙ and the spin to be > 0.8 at 2σ (97.8% single–sided for the spin value) confidence.
From the fit statistics (C-stat), this scenario involving early–time θ variation appears to describe the data better than the previous scenario of no θ changes between all data epochs, with the C-stat improving from 136.9 with 124 degrees of freedom to 119.0 with 123 degrees of freedom. However, based on the polynomial expressions given by Kaastra (2017), we calculated the expected value of C-stat, Ce ≈ 135, with an RMS of ≈16. We also checked the spectral fits in the data–model ratio plot (Fig. 1) and found no significant differences between the two fits. No signs of overfitting are found. Therefore, in this paper, we consider both scenarios to be good descriptions of the data and our main results. We note that although the data are sufficiently explained by either ṁ or θ variation between epochs, a scenario in which both parameters vary over time is not excluded.
The spectra at S1 and C1 are likely aligned–disc spectra regardless of scenarios explaining the source behaviour at earlier epochs (X1 to X3). By fitting only these two spectra, however, we find that they alone do not distinguish between different scenarios due to low photon counts. We also verify that our choices of CXRT = 1 and CACIS = 1 during the joint fits (Tabel D.1 or Tabel D.2) do not yield black hole mass and spin values that fail to explain the spectra at S1 or C1.
3.2. An unusual short-term variability pattern for a QPE
The ∼3.8 h variability observed in J1231 has been proposed to arise from a QPE. A known QPE variability pattern is described as the ‘hard-rise-soft-decay’ mode, in which the hard X–ray flux peaks before the soft flux during each eruption (e.g. Miniutti et al. 2019; Arcodia et al. 2024; Giustini et al. 2024). To test whether J1231 exhibits similar spectral evolution to known QPE sources, we examined the light curves at four energy bands: 0.3–0.5 keV, 0.5–0.7 keV, 0.7–1.0 keV, and 1.0–2.0 keV. We find no clear evidence that the peaks in the hard bands (0.7–1.0 keV or 1.0–2.0 keV) precede those of the soft band (0.3–0.5 keV) in time. Figure 4 presents the phase–folded EPIC pn light curves at epochs X2 and X3. The periods for X2 and X3 are 13.52 ks and 14.35 ks, respectively (Webbe & Young 2023). When phase-folding the light curves of epochs X2 and X3, we set the start time (T = 0) to be at 2.50856724E+08 s and at 2.51185225E+08 s, respectively. These times are expressed as offsets in seconds from the XMM-Newton Mission Reference Time (MRT), defined as 1997 December 31 at 23:58:56.816 UTC.
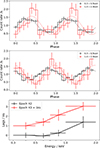 |
Fig. 4. Top panel: Phase–folded light curves of epoch X2. Light curves are extracted at different energy bands: 0.3–0.5 keV, 0.5–0.7 keV, 0.7–1.0 keV, and 1.0–2.0 keV. For clarity, only the 0.3–0.5 keV and1.0–2.0 keV light curves are shown. Dotted lines indicate the best-fit sinusoidal functions to the data (χ2/degree of freedom < 2 for each energy band). Middle panel: Phase–folded light curves of epoch X3. Bottom panel: Time lags of the light curves in different energy bands with respect to the reference band of 0.3–0.5 keV. A positive lag indicates that the given band lags behind the reference band in X–ray signals. The date points for epoch X3 are shifted by +1 ks in time difference for clarity. The J1231 data show that the hard band (1.0–2.0 keV) lags the soft band (0.3–0.5 keV) in time (1.4 ± 0.9 ks at X2, and 2.0 ± 0.8 ks at X3). J1231 is thus unlike QPEs, which typically show a ‘hard–rise–soft–decay’ mode, where the hard band leads the soft band during each eruption. |
To quantify the time lags, we fitted the phase–folded light curves with a sinusoidal fit function CRi = Aisin[2π(x − li)] + CR0, i, where CRi is the count rate in the energy band i, Ai is the amplitude, x is the phase value from the x-axis, li is the phase shift, and CR0, i is the count rate at phase x = li. The phase lag Δl is defined as the change in l between our energy band of interest and the reference band. We then inferred the time lags between peaks at different energy bands by multiplying the phase lags by the periods. In this context, a positive time lag indicates that the energy band of interest lags behind the reference band in the X–ray signals. The time lag–energy plot (Fig. 4; reference band 0.3–0.5 keV) shows that, during the short–term variability in both epochs X2 and X3, the 1.0–2.0 keV band lags the 0.3–0.5 keV band in time, by 1.4 ± 0.9 ks at X2, and by 2.0 ± 0.8 ks at X3. This observed lag is inconsistent with the hard-rise-soft-decay eruption, in which the hard bands lead the soft bands. This suggests that the X-ray spectral variability of J1231 differs from that of typical QPEs during flares.
3.3. Short–term variability from a changing disc accretion rate or inclination?
We also fitted the slim disc model to the time–resolved spectra within X2 and X3, to test whether the quasi–periodic variability at X2 or X3 introduces changes in the spectral shape within a single observation. Based on the XMM-Newton EPIC pn light curves, we selected spectra according to the 0.3–2.0 keV count rate during local light curve maxima and minima, and then averaged those spectra to create composite peak and valley spectra, respectively. Owing to the light curve evolution between cycles, it was not possible to apply strict count rate criteria for peaks and valleys across different cycles. As the variability is not strictly periodic, we cannot separate the peaks and valleys using phase changes from a fixed period to create the phase–resolved spectra. We therefore manually selected time intervals for peaks and valleys, discarding the data in between. Next, we employed the SAS command GTIBUILD to combine the data from the selected time intervals and generate average peak and valley spectra from both pn and MOS for both epochs X2 and X3. We refer to the peak spectra as X2–p and X3–p, and to the valley spectra as X2–v and X3–v. Due to the decrease in the source count rate below that of the background for energy bins > 1 keV, we only considered the energy range 0.3–1.0 keV for the X2–v and X3–v spectra in the analysis. Figure 5 shows the time intervals selected during X2 and X3, which we also list in the appendix.
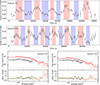 |
Fig. 5. Top panels: 0.3–2.0 keV light curves in the X2 (top) and X3 (middle) epochs, rebinned to 1000 s per time bin. The time intervals used to generate the spectra are marked in red (peaks: X2–p and X3–p) and blue (valleys: X2–v and X3–v). These intervals were manually selected and spectra within each set were averaged. The unselected data, shown in white, are not considered. Exact time intervals are listed in the appendix. Bottom panels: For each epoch, the black and red spectra correspond to the valley and peak EPIC pn data, respectively. The EPIC MOS data are excluded from the plots for clarity only. Solid, dashed, and dotted lines indicate the total model, the slim disc, and the background components, respectively. As the background spectra are identical between valleys and peaks, only the peak backgrounds are shown. We fix the best-fit slim disc model parameters (Table D.1), allowing only the ṁ to vary when fitting the peak and valley spectra. This approach yields good fits to the peak and valley spectra (see Table D.3 for the parameter constraints). Some residuals remain near ∼2 keV, where the background is dominant. |
At each epoch, we fitted a composite spectrum created from averaging the spectra at the peaks of the short-term variability, and a composite spectrum from averaging the spectra at the valleys. Our multi–epoch disc modelling in Sect. 3.1 reveals that at X2 and X3, the average values of {ṁ, θ} can both be either high (∼ 10 ṁEdd, ∼70°) or low (≲ ṁEdd, < 30°). For each scenario, we tested whether the spectral difference between the peaks and valleys could be explained by a single changing parameter associated with the disc (ṁ or θ).
For the scenario of low average θ at X2 and X3, we fixed the values of M• and a• to the best–fit values from Table D.1. Within both X2 and X3, the spectral difference between the peaks and valleys can be explained by a changing mass accretion rate (Fig. 5 and Table D.3), while θ is fixed to 10°. Here Ce is ≈68 with an RMS of ≈12 for both epochs. Meanwhile, the model is rejected by the data at the 99% confidence level (C-stat > Ce + 2.33×RMS) if we force ṁ to be the same (ṁ = 0.93 for X2 and ṁ = 0.65 for X3) and allow θ to change between peaks and valleys. Therefore, if the system has a low average θ at X2 and X3, the data are consistent with a varying ṁ, explaining the short–term spectral variability at X2 and X3. This conclusion ṁ holds qualitatively when we assume the case of the smallest spin value based on the results in Fig. 3 (M• = 3 × 10⁴ M⊙ and a• = 0.6; see Table D.4).
For the scenario of high average θ, similar to the low–θ case above, we fixed the values of M• and a• to the best–fit values from Table D.2 and tested whether the spectral difference between the peaks and valleys could be explained by a single ṁ or θ parameter. The model is rejected by the data at one or both epochs at the 99% and 95% confidence levels (C-stat > Ce + 1.645 × RMS), for the varying–ṁ case and the varying–θ case, respectively. We note that a good fit with large uncertainties can be achieved by allowing both ṁ and θ to vary between peaks and valleys (see Table D.5).
4. Discussion
4.1. A rapidly spinning IMBH
Despite the various scenarios explaining the spectral evolution, we constrain the black hole mass of J1231 to be (6 ± 3)×104 M⊙ (Fig. 3), consistent with the estimate obtained by extrapolating the scaling relation for black hole mass and the optically derived host galaxy velocity dispersion: ∼105 M⊙ (Ho et al. 2012). Depending on the assumptions of a• and the presence of a corona, studies using the AGN–like, thin–disc model have found the M• constraints to range from ∼4 × 10⁴ to ∼2 × 10⁶ M⊙ (Lin et al. 2013a, 2017). Our study more strongly supports that the central engine of J1231 is an IMBH, taking into account the significant disc advection in Eddington and super Eddington discs (especially for the super Eddington scenario with a varying θ; Table D.2).
Furthermore, our disc modelling indicates that the black hole has a high spin: a• > 0.6. A highly spinning IMBH of ≲105 M⊙ could be formed via direct collapse of a gas cloud in the early Universe (e.g. Loeb & Rasio 1994; Bromm & Loeb 2003). Simulations have shown that a• > 0.9 can be produced if the collapsing cloud goes through a supermassive stellar (SMS) phase before collapsing into a black hole (e.g. Reisswig et al. 2013; Inayoshi et al. 2014). Alternatively, if the black hole was born at a much lower mass (≲103 M⊙; e.g. via stellar remnants or gravitational runaway stellar collisions Madau & Rees 2001; Portegies Zwart & McMillan 2002; Devecchi & Volonteri 2009; Greif et al. 2011), then it must have gained its last e-fold in mass through subsequent accretion episodes. In such cases, reaching a high spin while avoiding being spun down due to multiple accretion episodes (e.g. King et al. 2008; Metzger & Stone 2016) requires that the seed black hole grew to its current mass in one or more accretion episodes where the angular momentum vector of the accreted material was aligned with that of the black hole spin.
4.2. Long–term X–ray evolution explained by disc changes
Figure 2 shows the long–term evolution of the J1231 disc luminosity in the 0.3–10 keV band, as well as the ṁ evolution derived from our analysis of the X-ray spectra based on the scenario of no θ changes between all data epochs. In this scenario, we find that the ṁ of the disc increases to ≈ ṁEdd at X2 and X3 compared to ≈ 0.4 ṁEdd at X1 two years earlier, before dropping to ∼0.1 ṁEdd at S1 and C1 several years later (Table D.1). Assuming a linear interpolation between epochs in Fig. 2, we roughly estimate the total mass accreted between 2004 and 2016 to be ∼0.01 M⊙. The small amount of total accreted mass suggests that if J1231 is a bona fide TDE (e.g. Rees 1988; Strubbe & Quataert 2009; Metzger & Stone 2016), it could be either a weak partial disruption that stripped off very little mass or a full disruption of a subsolar object such as a brown dwarf or large gas giant.
Regardless of whether J1231 is a TDE or is due solely to an active nucleus, in this scenario (Table D.1), ṁ at all epochs lies in the range ṁEdd ≳ ṁ ≳ 0.1ṁEdd. Classical disc theories predict that a disc radiation-pressure instability occurs in this ṁ range (e.g. Lightman & Eardley 1974; Shakura & Sunyaev 1976; Piran 1978; see Czerny 2019 for a review), preventing a steady ṁ in this instability range and forcing the disc to go through the so–called limit cycle (e.g. Lasota & Pelat 1991; Szuszkiewicz & Miller 1998; Xue et al. 2011). In such a case, the ṁ should avoid values in the instability range over a timescale longer than the thermal timescale at the outer edge of the disc instability zone (∼days in the J1231 case).
However, observational evidence from the XRB population indicates that a steady disc with ṁ in the ṁEdd ≳ ṁ ≳ 0.1ṁEdd instability range remains likely. Except for two XRBs (GRS 1915+105 and IGR J17091-3624; e.g. Belloni et al. 1997; Janiuk et al. 2000, 2015; Altamirano et al. 2011), most XRB discs in the range ṁEdd ≳ ṁ ≳ 0.1ṁEdd do not have signs of radiation–pressure instability (e.g. Gierliński & Done 2004; Czerny 2019). Other factors, such as magnetic fields, are proposed to stabilise the accretion disc to prevent a limit cycle from occurring (e.g. Janiuk & Czerny 2011; Kaur et al. 2023). Strong outflows when disc accretion is at high Eddington or super Eddington levels (e.g. Middleton et al. 2013; Pinto et al. 2016, 2021; Kara et al. 2018; Pasham et al. 2024a) will also help to stabilise the disc. These stabilising mechanisms could be important in J1231, as we find that, at all data epochs and for constant θ across all epochs, the source spectrum is always consistent with a steady disc model with ṁ in the range ṁEdd ≳ ṁ ≳ 0.1ṁEdd. Meanwhile, as long as disc instability is avoided, the slim disc model remains applicable to the S1 and C1 spectra at ∼ 0.1 ṁEdd, since the slim disc and thin disc share the same branch of disc solutions, with the additional terms in the slim disc model automatically becoming insignificant if ṁ < < ṁEdd (e.g. Abramowicz & Fragile 2013; Czerny 2019).
Lin et al. (2017) suggest several scenarios to explain the luminosity increase from X1 to X2, including the possibility that the X1 epoch captured the initial fast rise of the TDE disc, a slow disc circularisation in the TDE (e.g. Guillochon & Ramirez-Ruiz 2015; Hayasaki & Jonker 2021), or a prolonged disruption of an evolved star (MacLeod et al. 2012; although this TDE subclass is generally considered unlikely (see, e.g. MacLeod et al. 2013; Kochanek 2016). In our study, we find that the source spectrum is always consistent with a disc spectrum starting from X1, results that are in line with the scenarios except for a slow disc circularisation process.
Lense–Thirring precession, arising from a misalignment between the black hole’s equatorial spin plane and the disc plane shortly after the TDE (e.g. Stone & Loeb 2012), may be responsible for J1231’s long–term variability. Observational evidence supports such a scenario in two TDEs (ASASSN-14li, Pasham et al. 2019; AT2020ocn, Pasham et al. 2024b; Cao et al. 2024). In the case of J1231, if a solar–type star is disrupted, the predicted precession period for a < 105 M⊙ black hole is ≳1 day, irrespective of the value of the black hole spin (e.g. Franchini et al. 2016; Teboul & Metzger 2023) (though we note that the precession period scales  at first order; e.g. Pasham et al. 2024b). We find that the luminosity changes from X1 to X3 can be well explained by a misaligned disc going through the alignment process, while ṁ stays at super Eddington (Table D.2). In this scenario, the θ variation during disc alignment causes the luminosity variation, which is sparsely sampled by three early XMM-Newton observations. It is also possible that QPOs are not observed at X1 but only at X2 and X3, because they are obscured by the edge of the slim disc, as θ becomes larger at X1 than at X2 or X3.
Meanwhile, Wen et al. (2020) find that a TDE observed nearly edge–on would also result in a slow luminosity rise after the disruption, due to the process they term disc slimming. Our results suggest that either the disc is viewed face–on (Table D.1), or the varying θ causes the luminosity change (Table D.2), thereby disfavouring the disc slimming scenario in J1231. A delayed X–ray luminosity increase relative to the initial disruption can also be explained by a partial TDE, in which the star is not fully disrupted during its first passage through the pericentre, allowing for subsequent disruptions and mass accretion (e.g. Wevers et al. 2023; Liu et al. 2023). Alternatively, J1231 might not be a TDE, but a variable AGN. However, in this case, J1231 would be atypical among AGNs in exhibiting purely thermal X–ray spectra, while only 1.5% of AGNs vary in X–rays by a factor greater than ten (Lin et al. 2012, 2017).
4.3. QPOs at X2 and X3 do not show the typical QPE mode
In addition to the long–term spectral evolution over a decade, J1231 exhibits a short–term X–ray variability at X2 and X3 on a timescale of ∼3.8 h (≈0.07 mHz). Lin et al. (2013a) first reported the variability and proposed that it is analogous to the LFQPOs detected in XRBs hosting stellar–mass black holes. Assuming a linear anti-correlation of the LFQPO frequency with black hole mass, a 0.07 mHz QPO in an accretion disc around a 6 × 10⁴ M⊙ black hole corresponds to ∼0.1 Hz for a 10 M⊙ black hole, consistent with the lower-frequency end of LFQPOs in XRBs (0.1–30 Hz; Belloni et al. 2002; Remillard & McClintock 2006). Furthermore, the disappearance of QPO features in J1231 (when the X–ray luminosity decreases at later epochs) resembles the spectral state transition between the ultra-luminous state (ULS; also known as the steep power-law state) to the thermal state in XRBs (e.g. Remillard & McClintock 2006; Li et al. 2014). We note that factors other than the black hole mass (e.g. disc accretion rate) may also impact the LFQPO frequency (e.g. McHardy et al. 2006; Li et al. 2014; van Doesburgh & van der Klis 2020).
The multi–epoch spectral analysis in Sect. 3.1 reveals that at X2 and X3, the average θ is either < 30° or ∼70°, depending on whether we assume a constant θ between all data epochs (Tables D.1 and D.2). For each scenario, we test whether a single disc parameter (ṁ or θ) could explain the short-term variability using the peak and valley spectra. For a face–on disc (θ < 30°), we find that a difference in ṁ explains the short–term spectral evolution, while the model varying only θ fails to explain the data; for a large θ ∼ 70°, however, the peak and valley spectra can only be simultaneously explained if both θ and ṁ vary between the peaks and valleys (see Sect. 3.3 for details of the tests). We note that these results do not exclude the large–θ scenario (i.e. Table D.2) as the explanation for the long-term X-ray variability of J1231, as the short–term variability could possibly be caused by mechanisms beyond the description of a quasi–stable slim disc (e.g. a localised disc region causing the variability, as proposed to explain QPOs; Tagger & Pellat 1999; Chakrabarti & Manickam 2000).
It has also been proposed that the short–term variability of J1231 is a variant of the QPEs seen in some TDEs and AGN (e.g. Miniutti et al. 2019; Giustini et al. 2020; Arcodia et al. 2021, 2024; Chakraborty et al. 2021; Evans et al. 2023; Quintin et al. 2023; Webbe & Young 2023; Nicholl et al. 2024; Guolo et al. 2024b). If the quasi–periodic signal at X2 and X3 is indeed due to QPEs, our results provide evidence that ṁ variation is the driver of the QPE phenomenon. Alternatively, the accretion disc might not be circularised or thermalised during a QPE (Krolik & Linial 2022; King 2023), so the slimdz model is not applicable to X2 and X3 (though we find the source is consistent with a disc spectrum at the valleys and peaks). However, we stress that the J1231 spectral variation at X2 and X3 differs from that observed in QPE sources. Contrary to the ‘hard-rise-soft-decay’ eruptions in typical QPE sources (e.g. GSN 069; Miniutti et al. 2019), in the phase–folded light curves we find that the hard energy band (1.0–2.0 keV) lags the soft band (0.3–0.5 keV), resulting in a “soft–rise–hard–decay” mode (Fig. 4). One possibility to explain the hard lag is that the ṁ variation propagates from the outer disc, where most soft photons originate, to the innermost disc region, where most harder photons originate. This propagation takes time, and thus leads to a delayed hard band variation. However, since the nature of QPEs remains the subject of active debate, it is unclear whether J1231 is a variant of the QPE phenomenon or not.
5. Conclusions
We present our spectral analysis of J1231’s evolving X–ray data, taken over more than a decade from 2003 to 2016. Using a slim disc model for the accretion disc around the black hole, we find that the decade–long spectral evolution of J1231 can be explained by a varying mass accretion rate. Alternatively, a varying disc inclination with a constant disc accretion rate can also explain the spectral evolution between the three XMM-Newton epochs within the first three years of the source’s detection. A misaligned disc initially formed after the disruption event could lead to this inclination variation. The best slim disc fit simultaneously to all spectra yields a black hole mass of (6 ± 3)×104 M⊙ at 2σ confidence, making J1231 one of only a handful of intermediate–mass black hole candidates in the range 102–105 M⊙. The black hole spin is > 0.6 at the 2σ 97.8% single–sided confidence level, indicating a rapid spin. The source spectra ≳10 years after the first observation are consistent with the same black hole mass and spin.
Previous studies have reported a short–term QPO with a ∼3.8 h period in the X-ray light curve of J1231 when the source luminosity peaks, i.e. during the second and third of the five epochs observed. We analysed the J1231 light curves from these two QPO epochs in four different energy bands and find that the 1.0–2.0 keV hard band lags the 0.3–0.5 keV soft band by ∼kiloseconds. This results in a soft-rise–hard-decay variation mode, which contrasts with the typical QPE mode of hard-rise-soft-decay, suggesting that J1231 is an atypical QPE candidate.
Furthermore, for each of the two QPO epochs, we produce a composite spectrum of the QPO peaks and one of the valleys. Our analysis of the peak and valley composite spectra suggests that the QPO behaviour could be driven by a varying disc accretion rate, though other possibilities are not excluded. Such an accretion rate variation could be caused by any of the mechanisms proposed for QPEs. The hard–to–soft lag is explained by the inward propagation of the accretion rate variation through the disc.
Data availability
All the X–ray data in this paper are publicly available from the data archive of HEASARC (https://heasarc.gsfc.nasa.gov/). A reproduction package is available at https://doi.org/10.5281/zenodo.14422714.
ObsID: 0145800101, 0306630101, and 0306630201, respectively.
In TBabs, the fraction of molecular hydrogen present as H2 is assumed to be 20% (Wilms et al. 2000), similar to the measured fraction along the line–of–sight towards J1231 (18.5%–20.3%; Willingale et al. 2013).
http://www.cosmos.esa.int/web/xmm-newton/mos1-ccd6
https://www.cosmos.esa.int/web/xmm-newton/sas-thread-epic-filterbackground
https://www.swift.ac.uk/user_objects/
Acknowledgments
We thank the referee for comments that helped to improve this manuscript. This work made use of data supplied by the UK Swift Science Data Centre at the University of Leicester. This work used the Dutch national e-infrastructure with the support of the SURF Cooperative using grant no. EINF-6770. PGJ is supported by the European Union (ERC, StarStruck, 101095973). Views and opinions expressed are however those of the author(s) only and do not necessarily reflect those of the European Union or the European Research Council. AIZ acknowledges support in part from grant NASA ADAP #80NSSC21K0988.
References
- Abramowicz, M. A., & Fragile, P. C. 2013, Liv. Rev. Relat., 16, 1 [Google Scholar]
- Abramowicz, M., Czerny, B., Lasota, J., & Szuszkiewicz, E. 1988, ApJ, 332, 646 [NASA ADS] [CrossRef] [Google Scholar]
- Altamirano, D., Belloni, T., Linares, M., et al. 2011, ApJ, 742, L17 [NASA ADS] [CrossRef] [Google Scholar]
- Arcodia, R., Merloni, A., Nandra, K., et al. 2021, Nature, 592, 704 [NASA ADS] [CrossRef] [Google Scholar]
- Arcodia, R., Liu, Z., Merloni, A., et al. 2024, A&A, 684, A64 [NASA ADS] [CrossRef] [EDP Sciences] [Google Scholar]
- Arnaud, K. 1996, in Astronomical Data Analysis Software and Systems V, 101, 17 [NASA ADS] [Google Scholar]
- Banados, E., Venemans, B. P., Mazzucchelli, C., et al. 2018, Nature, 553, 473 [NASA ADS] [CrossRef] [Google Scholar]
- Belloni, T., Mendez, M., King, A., van der Klis, M., & Van Paradijs, J. 1997, ApJ, 488, L109 [NASA ADS] [CrossRef] [Google Scholar]
- Belloni, T., Psaltis, D., & van der Klis, M. 2002, ApJ, 572, 392 [NASA ADS] [CrossRef] [Google Scholar]
- Bromm, V., & Loeb, A. 2003, ApJ, 596, 34 [Google Scholar]
- Cao, Z., Jonker, P., Wen, S., Stone, N., & Zabludoff, A. 2023, MNRAS, 519, 2375 [Google Scholar]
- Cao, Z., Jonker, P., Pasham, D., et al. 2024, ApJ, 970, 89 [NASA ADS] [CrossRef] [Google Scholar]
- Cash, W. 1979, ApJ, 228, 939 [Google Scholar]
- Chakrabarti, S. K., & Manickam, S. G. 2000, ApJ, 531, L41 [NASA ADS] [CrossRef] [Google Scholar]
- Chakraborty, J., Kara, E., Masterson, M., et al. 2021, ApJ, 921, L40 [NASA ADS] [CrossRef] [Google Scholar]
- Czerny, B. 2019, Universe, 5, 131 [NASA ADS] [CrossRef] [Google Scholar]
- Devecchi, B., & Volonteri, M. 2009, ApJ, 694, 302 [NASA ADS] [CrossRef] [Google Scholar]
- Done, C., Davis, S., Jin, C., Blaes, O., & Ward, M. 2012, MNRAS, 420, 1848 [NASA ADS] [CrossRef] [Google Scholar]
- Evans, P., Beardmore, A., Page, K., et al. 2009, MNRAS, 397, 1177 [NASA ADS] [CrossRef] [Google Scholar]
- Evans, P., Nixon, C., Campana, S., et al. 2023, Nat. Astron., 7, 1368 [NASA ADS] [CrossRef] [Google Scholar]
- Franchini, A., Lodato, G., & Facchini, S. 2016, MNRAS, 455, 1946 [NASA ADS] [CrossRef] [Google Scholar]
- Gierliński, M., & Done, C. 2004, MNRAS, 347, 885 [Google Scholar]
- Giustini, M., Miniutti, G., & Saxton, R. D. 2020, A&A, 636, L2 [NASA ADS] [CrossRef] [EDP Sciences] [Google Scholar]
- Giustini, M., Miniutti, G., Arcodia, R., et al. 2024, A&A, 692, A15 [NASA ADS] [CrossRef] [EDP Sciences] [Google Scholar]
- Greene, J. E., Strader, J., & Ho, L. C. 2020, ARA&A, 58, 257 [Google Scholar]
- Greif, T. H., Springel, V., White, S. D., et al. 2011, ApJ, 737, 75 [NASA ADS] [CrossRef] [Google Scholar]
- Grupe, D., Komossa, S., & Saxton, R. 2015, ApJ, 803, L28 [NASA ADS] [CrossRef] [Google Scholar]
- Guillochon, J., & Ramirez-Ruiz, E. 2015, ApJ, 809, 166 [Google Scholar]
- Guolo, M., Gezari, S., Yao, Y., et al. 2024a, ApJ, 966, 160 [NASA ADS] [CrossRef] [Google Scholar]
- Guolo, M., Pasham, D. R., Zajaček, M., et al. 2024b, Nat. Astron., 8, 347 [Google Scholar]
- Harrison, F. A., Boggs, S., Christensen, F., et al. 2010, in Space Telescopes and Instrumentation 2010: Ultraviolet to Gamma Ray (SPIE), 7732, 189 [Google Scholar]
- Hayasaki, K., & Jonker, P. G. 2021, ApJ, 921, 20 [NASA ADS] [CrossRef] [Google Scholar]
- Hills, J. G. 1975, Nature, 254, 295 [Google Scholar]
- Ho, L. C., Kim, M., & Terashima, Y. 2012, ApJ, 759, L16 [NASA ADS] [CrossRef] [Google Scholar]
- Inayoshi, K., Omukai, K., & Tasker, E. 2014, MNRAS, 445, L109 [NASA ADS] [CrossRef] [Google Scholar]
- Inayoshi, K., Visbal, E., & Haiman, Z. 2020, ARA&A, 58, 27 [NASA ADS] [CrossRef] [Google Scholar]
- Inkenhaag, A., Jonker, P. G., Cannizzaro, G., Mata Sánchez, D., & Saxton, R. D. 2021, MNRAS, 507, 6196 [Google Scholar]
- Janiuk, A., & Czerny, B. 2011, MNRAS, 414, 2186 [NASA ADS] [CrossRef] [Google Scholar]
- Janiuk, A., Czerny, B., & Siemiginowska, A. 2000, ApJ, 542, L33 [NASA ADS] [CrossRef] [Google Scholar]
- Janiuk, A., Grzedzielski, M., Capitanio, F., & Bianchi, S. 2015, A&A, 574, A92 [NASA ADS] [CrossRef] [EDP Sciences] [Google Scholar]
- Kaastra, J. 2017, A&A, 605, A51 [NASA ADS] [CrossRef] [EDP Sciences] [Google Scholar]
- Kaastra, J., & Bleeker, J. 2016, A&A, 587, A151 [NASA ADS] [CrossRef] [EDP Sciences] [Google Scholar]
- Kalberla, P. M., Burton, W., Hartmann, D., et al. 2005, A&A, 440, 775 [NASA ADS] [CrossRef] [EDP Sciences] [Google Scholar]
- Kara, E., Dai, L., Reynolds, C., & Kallman, T. 2018, MNRAS, 474, 3593 [Google Scholar]
- Katayama, H., Takahashi, I., Ikebe, Y., Matsushita, K., & Freyberg, M. 2004, A&A, 414, 767 [NASA ADS] [CrossRef] [EDP Sciences] [Google Scholar]
- Kaur, K., Stone, N. C., & Gilbaum, S. 2023, MNRAS, 524, 1269 [NASA ADS] [CrossRef] [Google Scholar]
- King, A. 2023, MNRAS: Letters, 523, L26 [Google Scholar]
- King, A., Pringle, J., & Hofmann, J. 2008, MNRAS, 385, 1621 [NASA ADS] [CrossRef] [Google Scholar]
- Kochanek, C. 2016, MNRAS, 461, 371 [NASA ADS] [CrossRef] [Google Scholar]
- Kormendy, J., & Ho, L. C. 2013, ARA&A, 51, 511 [Google Scholar]
- Krolik, J. H., & Linial, I. 2022, ApJ, 941, 24 [NASA ADS] [CrossRef] [Google Scholar]
- Lasota, J., & Pelat, D. 1991, in Structure and Emission Properties of Accretion Disks: Proceedings of the Sixth IAP Astrophysics Meeting No. 129, Atlantica Séguier Frontières, 467 [Google Scholar]
- Li, Z., Gao, H., Zhang, Z., et al. 2014, MNRAS, 440, 143 [Google Scholar]
- Lightman, A. P., & Eardley, D. M. 1974, ApJ, 187, L1 [Google Scholar]
- Lin, D., Webb, N. A., & Barret, D. 2012, ApJ, 756, 27 [NASA ADS] [CrossRef] [Google Scholar]
- Lin, D., Irwin, J. A., Godet, O., Webb, N. A., & Barret, D. 2013a, ApJ, 776, L10 [NASA ADS] [CrossRef] [Google Scholar]
- Lin, D., Webb, N. A., & Barret, D. 2013b, ApJ, 780, 39 [Google Scholar]
- Lin, D., Godet, O., Ho, L. C., et al. 2017, MNRAS, 468, 783 [Google Scholar]
- Liu, Z., Malyali, A., Krumpe, M., et al. 2023, A&A, 669, A75 [NASA ADS] [CrossRef] [EDP Sciences] [Google Scholar]
- Lodato, G., & Rossi, E. M. 2011, MNRAS, 410, 359 [Google Scholar]
- Loeb, A., & Rasio, F. A. 1994, ApJ, 432, 52 [Google Scholar]
- MacLeod, M., Guillochon, J., & Ramirez-Ruiz, E. 2012, ApJ, 757, 134 [Google Scholar]
- MacLeod, M., Ramirez-Ruiz, E., Grady, S., & Guillochon, J. 2013, ApJ, 777, 133 [NASA ADS] [CrossRef] [Google Scholar]
- Madau, P., & Rees, M. J. 2001, ApJ, 551, L27 [Google Scholar]
- Maksym, W. P., Lin, D., & Irwin, J. A. 2014, ApJ, 792, L29 [Google Scholar]
- McHardy, I. M., Koerding, E., Knigge, C., Uttley, P., & Fender, R. 2006, Nat, 444, 730 [NASA ADS] [CrossRef] [Google Scholar]
- Metzger, B. D., & Stone, N. C. 2016, MNRAS, 461, 948 [NASA ADS] [CrossRef] [Google Scholar]
- Middleton, M. J., Walton, D. J., Roberts, T. P., & Heil, L. 2013, MNRAS, 438, L51 [Google Scholar]
- Miniutti, G., Saxton, R., Giustini, M., et al. 2019, Nat, 573, 381 [Google Scholar]
- Natarajan, P. 2014, GReGr, 46, 1 [Google Scholar]
- Nicholl, M., Pasham, D. R., Mummery, A., et al. 2024, Nature, 634, 804 [CrossRef] [Google Scholar]
- Pacucci, F., Loeb, A., Mezcua, M., & Martín-Navarro, I. 2018, ApJ, 864, L6 [CrossRef] [Google Scholar]
- Pagani, C., Morris, D., Racusin, J., et al. 2007, in UV, X-Ray, and Gamma-Ray Space Instrumentation for Astronomy XV (SPIE), 6686, 80 [Google Scholar]
- Pasham, D. R., Remillard, R. A., Fragile, P. C., et al. 2019, Sci, 363, 531 [Google Scholar]
- Pasham, D. R., Tombesi, F., Suková, P., et al. 2024a, Sci. Adv., 10, eadj8898 [Google Scholar]
- Pasham, D. R., Zajaček, M., Nixon, C., et al. 2024b, Nature, 630, 325 [NASA ADS] [CrossRef] [Google Scholar]
- Pinto, C., Middleton, M. J., & Fabian, A. C. 2016, Nature, 533, 64 [Google Scholar]
- Pinto, C., Soria, R., Walton, D., et al. 2021, MNRAS, 505, 5058 [NASA ADS] [CrossRef] [Google Scholar]
- Piran, T. 1978, ApJ, 221, 652 [Google Scholar]
- Plucinsky, P. P., Beardmore, A. P., Foster, A., et al. 2017, A&A, 597, A35 [NASA ADS] [CrossRef] [EDP Sciences] [Google Scholar]
- Portegies Zwart, S. F., & McMillan, S. L. 2002, ApJ, 576, 899 [NASA ADS] [CrossRef] [Google Scholar]
- Quintin, E., Webb, N., Guillot, S., et al. 2023, A&A, 675, A152 [NASA ADS] [CrossRef] [EDP Sciences] [Google Scholar]
- Rees, M. J. 1988, Nature, 333, 523 [Google Scholar]
- Reisswig, C., Ott, C. D., Abdikamalov, E., et al. 2013, PRL, 151101, 1 [Google Scholar]
- Remillard, R. A., & McClintock, J. E. 2006, ARA&A, 44, 49 [Google Scholar]
- Saxton, R. D., Motta, S. E., Komossa, S., & Read, A. M. 2015, MNRAS, 454, 2798 [NASA ADS] [CrossRef] [Google Scholar]
- Shakura, N., & Sunyaev, R. 1976, MNRAS, 175, 613 [NASA ADS] [CrossRef] [Google Scholar]
- Shankar, F., Bernardi, M., Sheth, R. K., et al. 2016, MNRAS, 460, 3119 [NASA ADS] [CrossRef] [Google Scholar]
- Stone, N., & Loeb, A. 2012, PRL, 108, 061302 [Google Scholar]
- Strubbe, L. E., & Quataert, E. 2009, MNRAS, 400, 2070 [NASA ADS] [CrossRef] [Google Scholar]
- Szuszkiewicz, E., & Miller, J. C. 1998, MNRAS, 298, 888 [Google Scholar]
- Tagger, M., & Pellat, R. 1999, A&A, 349, 1003 [NASA ADS] [Google Scholar]
- Teboul, O., & Metzger, B. D. 2023, ApJ, 957, L9 [Google Scholar]
- Terashima, Y., Kamizasa, N., Awaki, H., Kubota, A., & Ueda, Y. 2012, ApJ, 752, 154 [NASA ADS] [CrossRef] [Google Scholar]
- Thorne, K. S. 1974, ApJ, 191, 507 [Google Scholar]
- Tubín-Arenas, D., Krumpe, M., Lamer, G., et al. 2024, A&A, 682, A35 [NASA ADS] [CrossRef] [EDP Sciences] [Google Scholar]
- Ulmer, A. 1999, ApJ, 514, 180 [Google Scholar]
- van Doesburgh, M., & van der Klis, M. 2020, MNRAS, 496, 5262 [Google Scholar]
- Voges, W., Aschenbach, B., Boller, T., et al. 1999, A&A, 349, 389 [NASA ADS] [Google Scholar]
- Volonteri, M. 2010, A&AR, 18, 279 [Google Scholar]
- Webbe, R., & Young, A. 2023, MNRAS, 518, 3428 [Google Scholar]
- Wen, S., Jonker, P. G., Stone, N. C., Zabludoff, A. I., & Psaltis, D. 2020, ApJ, 897, 80 [NASA ADS] [CrossRef] [Google Scholar]
- Wen, S., Jonker, P. G., Stone, N. C., & Zabludoff, A. I. 2021, ApJ, 918, 46 [NASA ADS] [CrossRef] [Google Scholar]
- Wen, S., Jonker, P. G., Stone, N. C., Zabludoff, A. I., & Cao, Z. 2022, ApJ, 933, 31 [NASA ADS] [CrossRef] [Google Scholar]
- Wevers, T., Coughlin, E., Pasham, D., et al. 2023, ApJ, 942, L33 [NASA ADS] [CrossRef] [Google Scholar]
- Willingale, R., Starling, R., Beardmore, A. P., Tanvir, N. R., & O’Brien, P. T. 2013, MNRAS, 431, 394 [NASA ADS] [CrossRef] [Google Scholar]
- Wilms, J., Allen, A., & McCray, R. 2000, ApJ, 542, 914 [Google Scholar]
- Xue, L., Sądowski, A., Abramowicz, M. A., & Lu, J.-F. 2011, ApJS, 195, 7 [Google Scholar]
Appendix A: X–ray data reduction
A.1. XMM-Newton observations
XMM-Newton observed J1231 over one epoch in 2003 and two in 2005. To perform the XMM-Newton data reduction and extract the scientific products, we use the HEASOFT (version 6.33.2) and SAS (version 21.0.0) software packages with the calibration files released on April 23, 2024 (CCF release: XMM-CCF-REL-411). The source is outside the field–of–view3 in one of the Metal Oxide Semi-conductor (MOS) cameras, MOS1, at Epoch X2 and X3. Meanwhile, the signal–to–noise ratio in the Reflection Grating Spectrometer (RGS) detectors is too low to perform spectral analysis. For consistency, in this paper we use only data from the pn and the MOS2 cameras (both are European Photon Imaging Cameras; EPICs). Therefore, we refer to MOS2 as MOS hereafter.
We use the SAS command EPPROC and EMPROC to process the Science 0 data from the pn and the MOS camera, respectively. We exclude the data from periods with an enhanced background count rate, applying the standard filtering criteria4 to each camera. We require that the 10–12 keV detection rate of pattern 0 events is < 0.4 counts s−1 for the pn camera, and the > 10 keV detection rate of pattern 0 events is < 0.35 counts s−1 for MOS. The first of the two X1 data segments (exposure ≲20 ks) is discarded due to the presence of strong background flares. We extract data of the source at RA = 12h31m03.24s, Dec=+11°06′48.6″ using circular regions centred on the source of 30″ and 45″ radii, for the pn and MOS cameras, respectively. These regions are larger than the circular source region of 25″ used in Lin et al. 2013b, and they encircle the ≳90% energy fraction at 1.0 keV for an off–axis (∼7′) point source. We check for the presence of photon pile–up using the SAS command EPATPLOT, and find no evidence for pile–up at any of the three epochs. The background spectra are extracted from circular apertures of ≳50″ radii that are free from sources. These circular regions used to measure the background spectrum lie close to the source and on the same detector as the source.
When performing spectral analysis for XMM-Newton data, we always jointly fit both the pn and the MOS spectra with the same fit function for the source spectra. To account for the instrument specific calibration differences, we use a constant component (constant in XSPEC) multiplying the source models. This constant serves as a renormalisation factor between different instruments. Specifically, we fix the constant to be 1 for the pn spectra, and let the constant for MOS (CMOS) free–to–vary in the fits for each epoch.
A.2. Swift observations
Swift performed 11 observations on the source J1231 between 2013 March and 2014 July. Following Lin et al. (2017), we treat all Swift data as one epoch (Epoch S1). We combine the X–ray Telescope (Swift/XRT) data of all observations and extract the time–averaged, source+background and the background X–ray spectra of J1231 using the online XRT pipeline5, applying the default reduction criteria (Evans et al. 2009).
A.3. Chandra observation
Chandra observed J1231 on 2016/02/10. We label the epoch as C1. We use CIAO (version 4.15) to perform the reduction of the data obtained by the Advanced CCD Imaging Spectrometer (ACIS) instrument onboard Chandra. We employ the CIAO command CHANDRA_REPRO for the data filtering, and SPECEXTRACT for extraction of the spectrum. The source counts are extracted from a circular source region of 1.6″ radius centred on the source (this of course also contains a small background contribution). This region corresponds to an encircled energy fraction of 95% at 1 keV for an on–axis point source. The background spectrum is extracted from a circular region of ∼20″ radius close to the source, on the same Chandra/ACIS chip, and free from sources.
Appendix B: Phenomenological characterisation of J1231 by blackbody models
We characterise the spectra of J1231 at different epochs using simple blackbody models (zbbody; spectral models are referred to in the XSPEC syntax hereafter). For Epochs X1, S1, and C1, the source spectrum is consistent with a blackbody model (the total fit function "constant*TBabs*zbbody"), while for X2 and X3 a second, hotter blackbody component is required to achieve a good–fit to the data (for these epochs the total fit function becomes "constant*TBabs*(zbbody+zbbody)"). The two–blackbody–like spectra with ṁ ∼ ṁEdd at Epochs X2 and X3 resemble several TDE spectra when accreting at high Eddington or super Eddington levels (e.g. Kara et al. 2018; Cao et al. 2023). We summarise the best–fit parameters in Table B.1. An example of the model fitted to the data at X2 is presented in Fig. B.1. The temperature of the primary blackbody component is ∼0.12 keV throughout the first four epochs before it drops to 0.07 ± 0.02 keV at the last epoch. For each epoch, we also test for the presence of intrinsic absorption (using the model zTBabs) and find that there is no evidence for significant intrinsic absorption (as also found by, e.g. Lin et al. 2013a, 2017). Therefore, we do not consider the intrinsic absorption in our analysis throughout the paper.
We also fit the time–resolved spectra produce in Section 3.3 using zbbody models. Best–fit parameters are summarised in Table B.2. The primary blackbody component at either X2 or X3, which dominates the 0.3–1.0 keV range, is consistent in temperature for the peak and valley composite spectra within the 1σ uncertainty errors. However, it is not possible to constrain the second blackbody component of higher temperature in X2–v and X3–v due to the low number of spectral counts. Therefore, we cannot assess whether the variability introduces spectral shape changes above 1.0 keV.
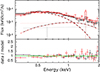 |
Fig. B.1. A phenomenological fit of two blackbodies (dashed and dot–dashed lines) to the XMM-Newton/EPIC pn (black) and XMM-NewtonMOS (red) data from X2. The dotted lines represent the background spectra for each instrument. The bottom panel shows the ratio between the observed number of counts in each spectral bin (data; black and red points in the top panel) and the best–fit predicted number of counts in each spectral bin (model; solid lines in the top panel). |
Parameter constraints derived from fitting the spectrum at each epoch with one or two black bodies.
Parameter constraints derived from fitting the spectrum at each epoch with one or two black bodies.
Appendix C: Generating the time–resolved spectra for X2 and X3
Here we list the time intervals selected for stacking the spectra of the peaks (X2–p and X3–p) and the valleys (X2–v and X3–v), as presented in Fig. 5. The intervals are given in offsets in seconds from the XMM-Newton Mission Reference Time (MRT, 1997-12-31T23:58:56.816 UTC), minus 2.50860675e+08 s. Both the pn and the MOS data use the same time intervals to produce the stacked spectra.
For X2–p spectrum: from 0 to 5500; from 15300 to 19700; from 28500 to 31500; from 39500 to 44500; from 56000 to 60000.
For X2–v spectrum: from 7000 to 13300; from 21500 to 27000; from 33500 to 36800; from 48000 to 52000.
For X3–p spectrum: from 328151 to 333151; from 342651 to 345151; from 356651 to 360651; from 369151 to 373151; from 382651 to 387151; from 397151 to 403151.
For X3–v spectrum: from 335151 to 340151; from 349151 to 354151; from 361651 to 366651; from 376651 to 380651; from 389651 to 394651; from 406151 to 410151.
Appendix D: Tables of fit parameter constraints
Parameter constraints for the joint fit of the spectra at all the epochs.
Parameter constraints for the joint fit of the spectra at all the epochs.
Parameter constraints from fitting the time–resolved spectra at X2 and X3 with the slimdz model.
Parameter constraints from fitting the time–resolved spectra at X2 and X3 with the slimdz model.
Parameter constraints from fitting the time–resolved spectra at X2 and X3 with the slimdz model.
All Tables
Parameter constraints derived from fitting the spectrum at each epoch with one or two black bodies.
Parameter constraints derived from fitting the spectrum at each epoch with one or two black bodies.
Parameter constraints from fitting the time–resolved spectra at X2 and X3 with the slimdz model.
Parameter constraints from fitting the time–resolved spectra at X2 and X3 with the slimdz model.
Parameter constraints from fitting the time–resolved spectra at X2 and X3 with the slimdz model.
All Figures
|
Fig. 1. Left: Joint fit of the J1231 data at five epochs (colour–coded) using the fit function constant*TBabs*slimdz. The EPIC MOS data are excluded for plot clarity only. The solid, dashed, and dotted lines represent the total model, the slim disc, and the background components, respectively. The bottom panel shows the ratio between observed counts per spectral bin (data) and the predicted counts from the best-fit model (solid lines in the top panel). The spectral evolution is well explained by a slim disc with only its ṁ varying between epochs (Table D.1). Right: Same as the left plot, but here the spectral evolution across the three XMM-Newton epochs is explained by a varying θ while the ṁ remains constant. |
| In the text | |
|
Fig. 2. Top panel: Disc luminosity in the 0.3–2.0 keV band versus time as derived from our spectral analysis assuming no disc inclination changes between epochs (Table D.1). The square, diamond, and triangle symbols represent the XMM-Newton, Swift, and Chandra observations, respectively. Upper limits from the ROSAT and eROSITA surveys are also shown (time-shifted for plotting clarity; Voges et al. 1999; Tubín-Arenas et al. 2024). Bottom panel: Fitted disc mass accretion rate ṁ for each epoch, normalised by the Eddington-limited accretion rate (computed assuming a black hole mass of 5.7 × 10⁴ M⊙). The dashed line indicates trans-Eddington accretion. |
| In the text | |
|
Fig. 3. Constraints on M• and a• from the slim disc model fit to the spectra obtained at all observing epochs. We calculate the ΔC-stat across the {M•, a•} plane with respect to the best–fit value (yellow marker) from Table D.1 (left) and from Table D.2 (right). Areas within the 1σ and 2σ confidence limits for two–parameter error estimates are shown in red and blue, respectively. Considering both scenarios, M• is constrained to be (6 ± 3)×104 M⊙ at the 2σ level for the two-parameter fits. The lower limit on the black hole spin is constrained to be > 0.6 at the 2σ (97.8%) single–sided confidence level. |
| In the text | |
|
Fig. 4. Top panel: Phase–folded light curves of epoch X2. Light curves are extracted at different energy bands: 0.3–0.5 keV, 0.5–0.7 keV, 0.7–1.0 keV, and 1.0–2.0 keV. For clarity, only the 0.3–0.5 keV and1.0–2.0 keV light curves are shown. Dotted lines indicate the best-fit sinusoidal functions to the data (χ2/degree of freedom < 2 for each energy band). Middle panel: Phase–folded light curves of epoch X3. Bottom panel: Time lags of the light curves in different energy bands with respect to the reference band of 0.3–0.5 keV. A positive lag indicates that the given band lags behind the reference band in X–ray signals. The date points for epoch X3 are shifted by +1 ks in time difference for clarity. The J1231 data show that the hard band (1.0–2.0 keV) lags the soft band (0.3–0.5 keV) in time (1.4 ± 0.9 ks at X2, and 2.0 ± 0.8 ks at X3). J1231 is thus unlike QPEs, which typically show a ‘hard–rise–soft–decay’ mode, where the hard band leads the soft band during each eruption. |
| In the text | |
|
Fig. 5. Top panels: 0.3–2.0 keV light curves in the X2 (top) and X3 (middle) epochs, rebinned to 1000 s per time bin. The time intervals used to generate the spectra are marked in red (peaks: X2–p and X3–p) and blue (valleys: X2–v and X3–v). These intervals were manually selected and spectra within each set were averaged. The unselected data, shown in white, are not considered. Exact time intervals are listed in the appendix. Bottom panels: For each epoch, the black and red spectra correspond to the valley and peak EPIC pn data, respectively. The EPIC MOS data are excluded from the plots for clarity only. Solid, dashed, and dotted lines indicate the total model, the slim disc, and the background components, respectively. As the background spectra are identical between valleys and peaks, only the peak backgrounds are shown. We fix the best-fit slim disc model parameters (Table D.1), allowing only the ṁ to vary when fitting the peak and valley spectra. This approach yields good fits to the peak and valley spectra (see Table D.3 for the parameter constraints). Some residuals remain near ∼2 keV, where the background is dominant. |
| In the text | |
|
Fig. B.1. A phenomenological fit of two blackbodies (dashed and dot–dashed lines) to the XMM-Newton/EPIC pn (black) and XMM-NewtonMOS (red) data from X2. The dotted lines represent the background spectra for each instrument. The bottom panel shows the ratio between the observed number of counts in each spectral bin (data; black and red points in the top panel) and the best–fit predicted number of counts in each spectral bin (model; solid lines in the top panel). |
| In the text | |
Current usage metrics show cumulative count of Article Views (full-text article views including HTML views, PDF and ePub downloads, according to the available data) and Abstracts Views on Vision4Press platform.
Data correspond to usage on the plateform after 2015. The current usage metrics is available 48-96 hours after online publication and is updated daily on week days.
Initial download of the metrics may take a while.