Fig. 2.
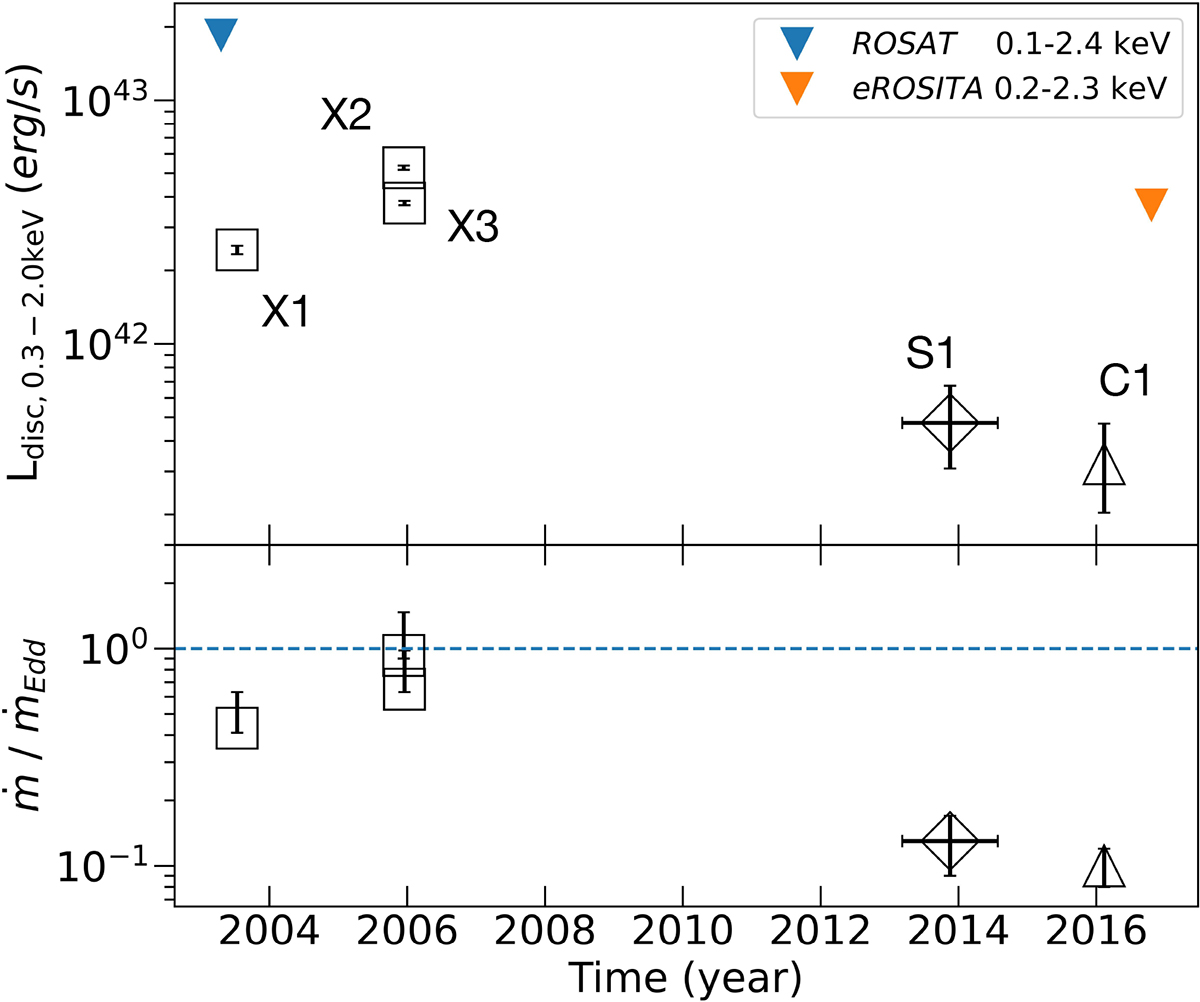
Download original image
Top panel: Disc luminosity in the 0.3–2.0 keV band versus time as derived from our spectral analysis assuming no disc inclination changes between epochs (Table D.1). The square, diamond, and triangle symbols represent the XMM-Newton, Swift, and Chandra observations, respectively. Upper limits from the ROSAT and eROSITA surveys are also shown (time-shifted for plotting clarity; Voges et al. 1999; Tubín-Arenas et al. 2024). Bottom panel: Fitted disc mass accretion rate ṁ for each epoch, normalised by the Eddington-limited accretion rate (computed assuming a black hole mass of 5.7 × 10⁴ M⊙). The dashed line indicates trans-Eddington accretion.
Current usage metrics show cumulative count of Article Views (full-text article views including HTML views, PDF and ePub downloads, according to the available data) and Abstracts Views on Vision4Press platform.
Data correspond to usage on the plateform after 2015. The current usage metrics is available 48-96 hours after online publication and is updated daily on week days.
Initial download of the metrics may take a while.