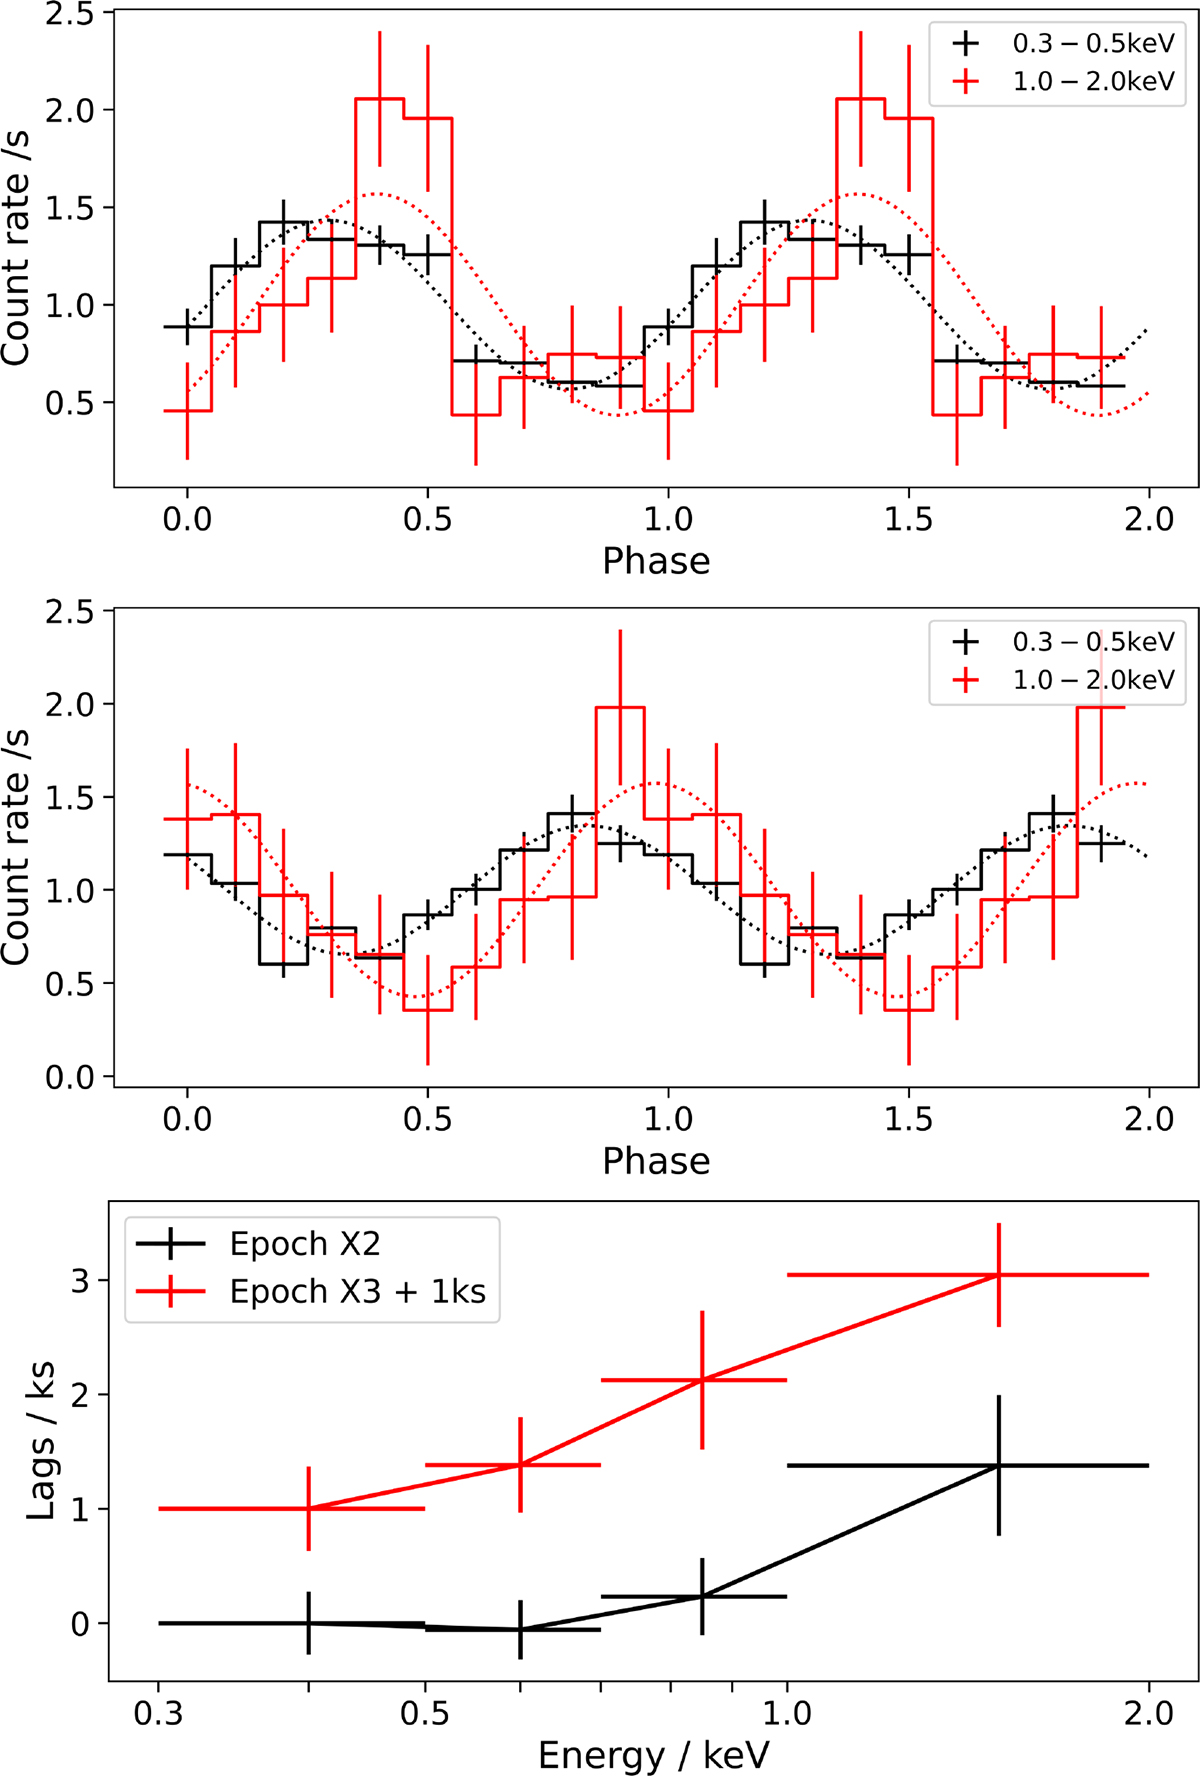
Fig. 4.
Download original image
Top panel: Phase–folded light curves of epoch X2. Light curves are extracted at different energy bands: 0.3–0.5 keV, 0.5–0.7 keV, 0.7–1.0 keV, and 1.0–2.0 keV. For clarity, only the 0.3–0.5 keV and1.0–2.0 keV light curves are shown. Dotted lines indicate the best-fit sinusoidal functions to the data (χ2/degree of freedom < 2 for each energy band). Middle panel: Phase–folded light curves of epoch X3. Bottom panel: Time lags of the light curves in different energy bands with respect to the reference band of 0.3–0.5 keV. A positive lag indicates that the given band lags behind the reference band in X–ray signals. The date points for epoch X3 are shifted by +1 ks in time difference for clarity. The J1231 data show that the hard band (1.0–2.0 keV) lags the soft band (0.3–0.5 keV) in time (1.4 ± 0.9 ks at X2, and 2.0 ± 0.8 ks at X3). J1231 is thus unlike QPEs, which typically show a ‘hard–rise–soft–decay’ mode, where the hard band leads the soft band during each eruption.
Current usage metrics show cumulative count of Article Views (full-text article views including HTML views, PDF and ePub downloads, according to the available data) and Abstracts Views on Vision4Press platform.
Data correspond to usage on the plateform after 2015. The current usage metrics is available 48-96 hours after online publication and is updated daily on week days.
Initial download of the metrics may take a while.