Fig. 5.
Download original image
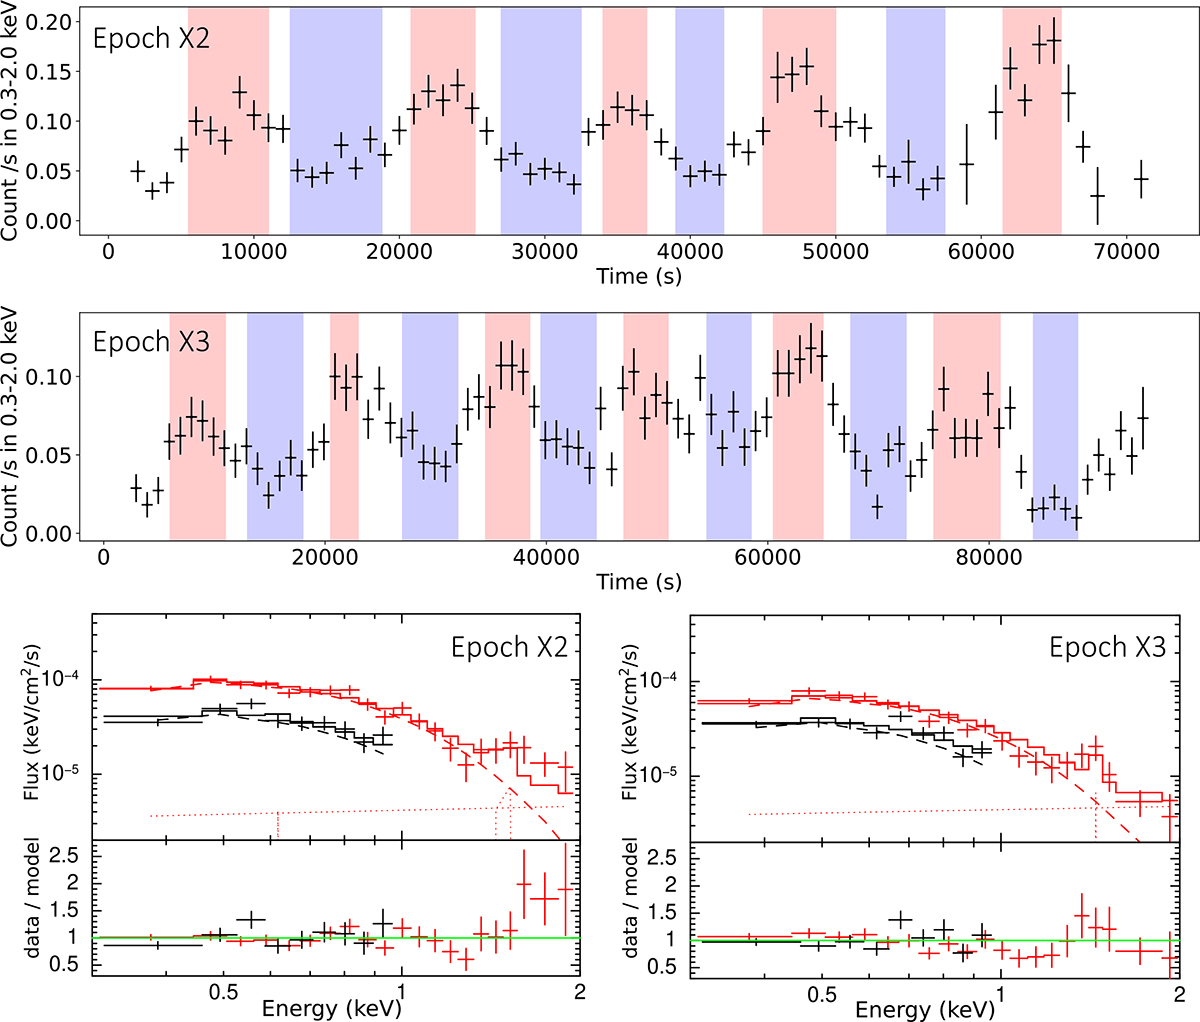
Top panels: 0.3–2.0 keV light curves in the X2 (top) and X3 (middle) epochs, rebinned to 1000 s per time bin. The time intervals used to generate the spectra are marked in red (peaks: X2–p and X3–p) and blue (valleys: X2–v and X3–v). These intervals were manually selected and spectra within each set were averaged. The unselected data, shown in white, are not considered. Exact time intervals are listed in the appendix. Bottom panels: For each epoch, the black and red spectra correspond to the valley and peak EPIC pn data, respectively. The EPIC MOS data are excluded from the plots for clarity only. Solid, dashed, and dotted lines indicate the total model, the slim disc, and the background components, respectively. As the background spectra are identical between valleys and peaks, only the peak backgrounds are shown. We fix the best-fit slim disc model parameters (Table D.1), allowing only the ṁ to vary when fitting the peak and valley spectra. This approach yields good fits to the peak and valley spectra (see Table D.3 for the parameter constraints). Some residuals remain near ∼2 keV, where the background is dominant.
Current usage metrics show cumulative count of Article Views (full-text article views including HTML views, PDF and ePub downloads, according to the available data) and Abstracts Views on Vision4Press platform.
Data correspond to usage on the plateform after 2015. The current usage metrics is available 48-96 hours after online publication and is updated daily on week days.
Initial download of the metrics may take a while.