Fig. 1.
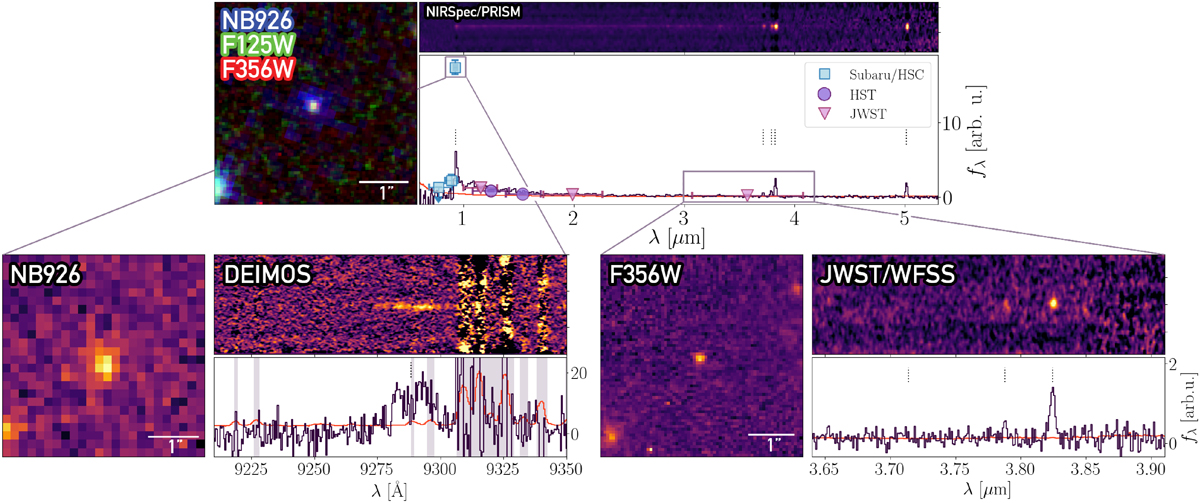
Download original image
The available photometric and spectroscopic dataset of LAE-11. (upper) A composite image of LAE-11 consisting of the NB926, F125W and F356W photometry, the 2D and 1D NIRSpec/PRISM spectrum of LAE-11 located at z = 6.6405 ± 0.0005. The uncertainty on each pixel of the 1D spectrum is represented with a red line. The vertical dotted lines represent detected emission lines. From left to right: Lyα, Hβ, [OIII] doublet, and Hα. The spectral energy distribution of LAE-11, encompassing photometric data from Subaru/HSC (blue squares), HST/WFC3 (purple circles), and JWST/NIRCam (pink triangles) is shown on top of the 1D NIRSpec spectrum. (lower)NB926 image, 2D and 1D Keck/DEIMOS spectrum of LAE-11 on the left with F356W image, 2D and 1D JWST/NIRCam WFSS spectrum of LAE-11 on the right. The uncertainty on each pixel in both spectra are represented with a red line. The vertical dashed lines mark the position of the Lyα in the DEIMOS spectrum, Hβ and [OIII] doublet emission lines in the NIRCam spectrum. The vertical shaded regions in the DEIMOS spectrum represent the skyline regions.
Current usage metrics show cumulative count of Article Views (full-text article views including HTML views, PDF and ePub downloads, according to the available data) and Abstracts Views on Vision4Press platform.
Data correspond to usage on the plateform after 2015. The current usage metrics is available 48-96 hours after online publication and is updated daily on week days.
Initial download of the metrics may take a while.