Fig. 10.
Download original image
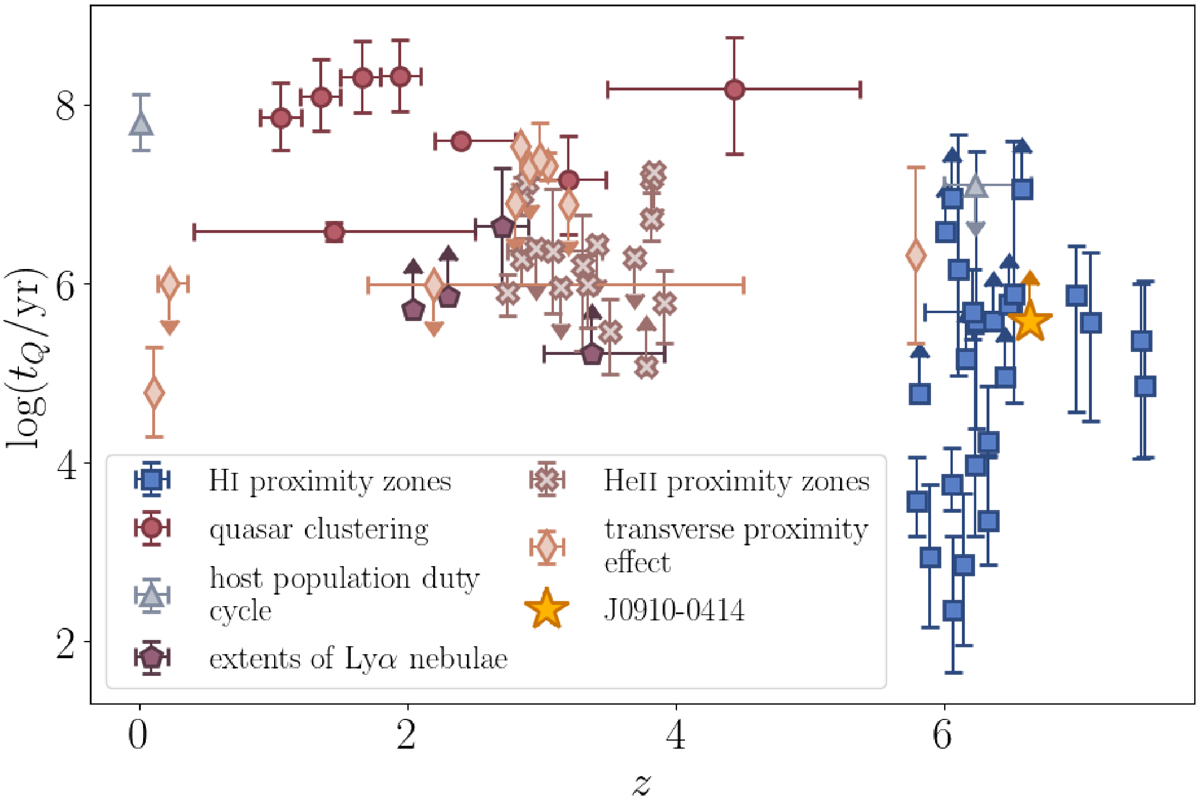
Quasar lifetimes from literature as a function of redshift. Measurements using HI proximity zones along the line of sight are shown with blue squares (Eilers et al. 2018, 2021; Davies et al. 2019, 2020; Andika et al. 2020; Morey et al. 2021), studies using quasar clustering are depicted with red circles (Shen et al. 2007; Shankar et al. 2010; White et al. 2012; Laurent et al. 2017). Measurements inferred from the duty cycle of the quasar host population are shown with grey triangles (Yu & Tremaine 2002; Chen & Gnedin 2018), while those using extends of Lyα nebulae are depicted with purple pentagons (Trainor & Steidel 2013; Cantalupo et al. 2014; Hennawi et al. 2015; Borisova et al. 2016). Furthermore, quasar lifetime estimates calculated from the HeII proximity zones are shown as light brown crosses (Khrykin et al. 2019, 2021; Worseck et al. 2021), and studies using the transverse proximity effect are marked with a pink diamond (Kirkman & Tytler 2008; Keel et al. 2012; Schmidt et al. 2017, 2018; Oppenheimer et al. 2018; Bosman et al. 2020). Our estimation of tQ for J0910-0414 is depicted with a yellow star. Adapted from Eilers et al. (2021).
Current usage metrics show cumulative count of Article Views (full-text article views including HTML views, PDF and ePub downloads, according to the available data) and Abstracts Views on Vision4Press platform.
Data correspond to usage on the plateform after 2015. The current usage metrics is available 48-96 hours after online publication and is updated daily on week days.
Initial download of the metrics may take a while.