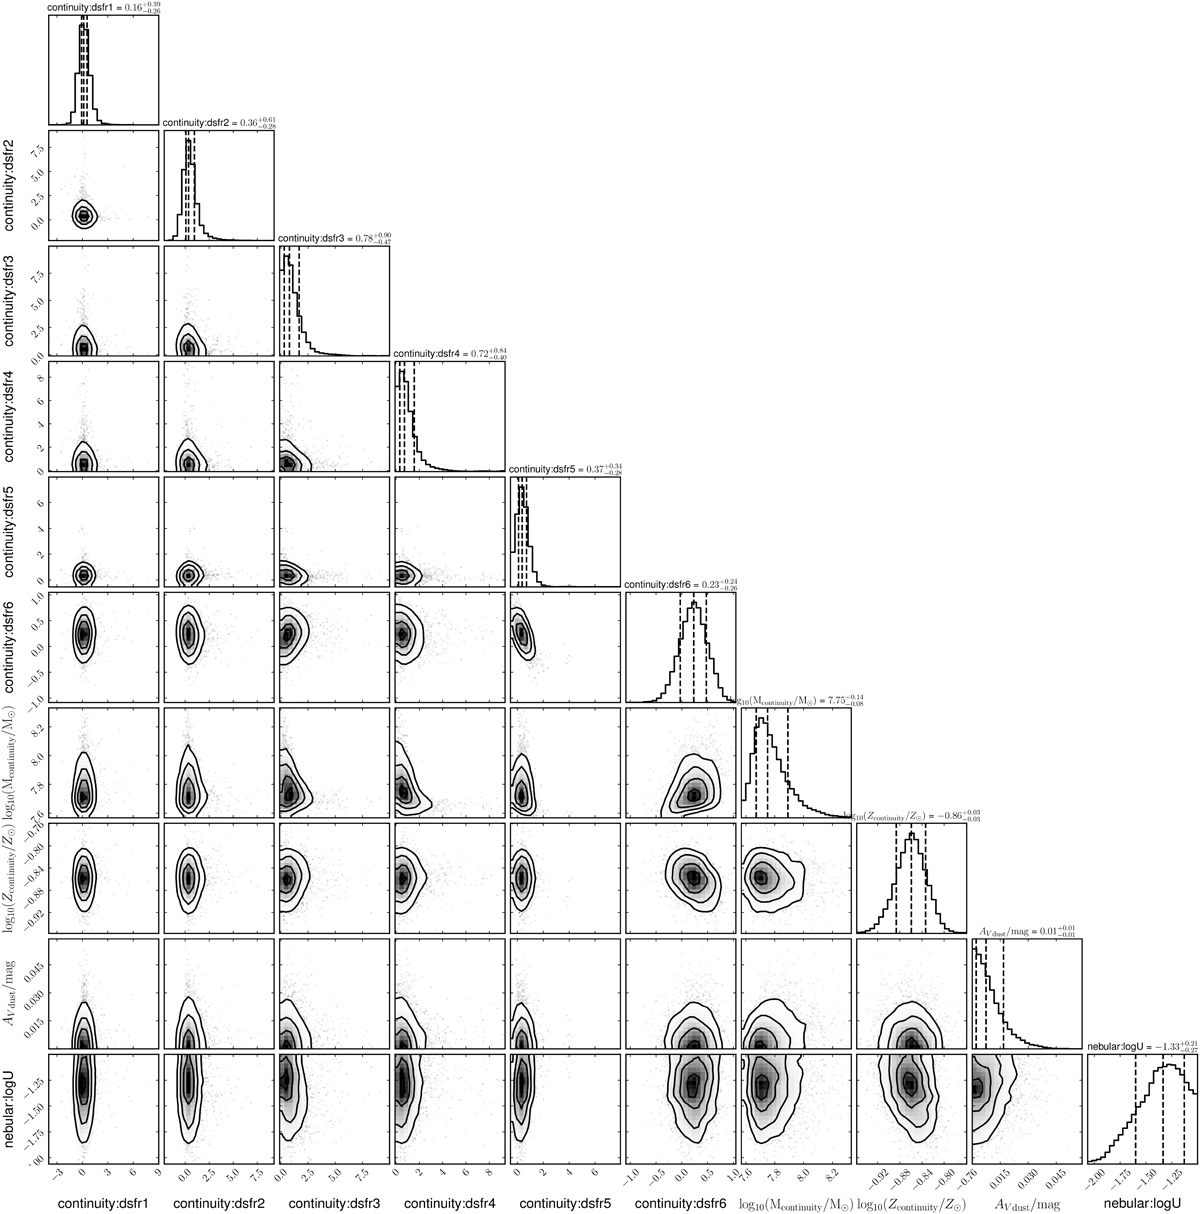
Fig. A.3.
Download original image
Corner plots showing the posterior distributions of the free parameters of the SED fit of LAE-11 using BAGPIPES. The contours indicate the 1σ, 2σ, and 3σ posterior of each parameter. The histogram of each parameter is shown on top of the corner plots, with the median shown with a dashed lines indicating the median and 1σ distribution.
Current usage metrics show cumulative count of Article Views (full-text article views including HTML views, PDF and ePub downloads, according to the available data) and Abstracts Views on Vision4Press platform.
Data correspond to usage on the plateform after 2015. The current usage metrics is available 48-96 hours after online publication and is updated daily on week days.
Initial download of the metrics may take a while.