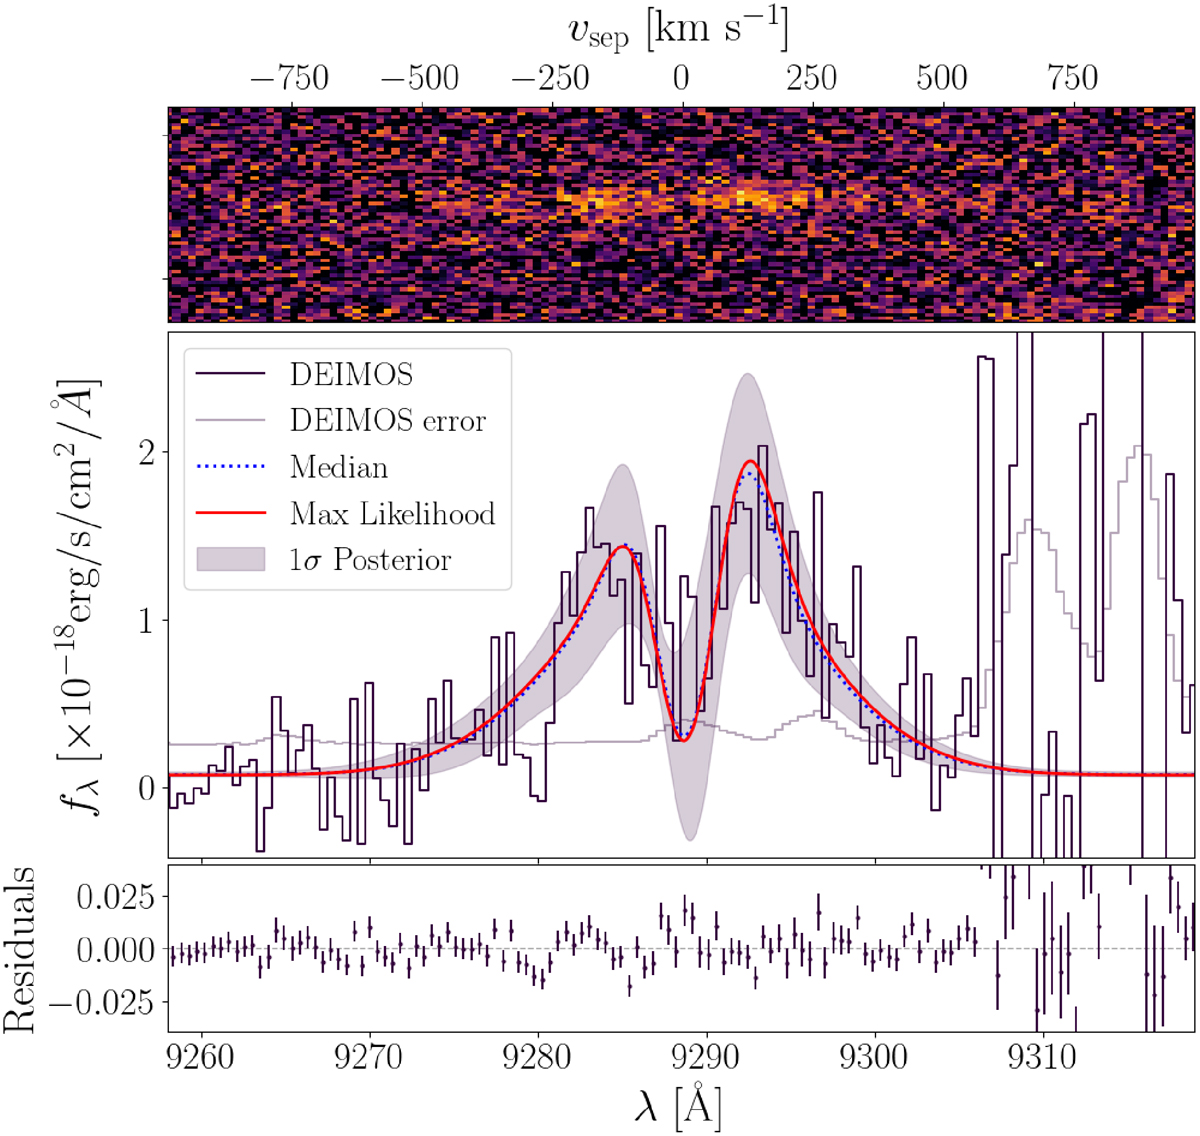
Fig. 2.
Download original image
(upper) 2D spectrum showcasing the double-peaked Lyα emission. The shell model fit to the Lyα line profile (middle) and the associated residuals (lower). The dark and light purple lines mark the observed spectrum and its uncertainty. The red line indicates the maximum likelihood model. The dotted blue line shows the median model and the shaded region marks its 1σ posterior.
Current usage metrics show cumulative count of Article Views (full-text article views including HTML views, PDF and ePub downloads, according to the available data) and Abstracts Views on Vision4Press platform.
Data correspond to usage on the plateform after 2015. The current usage metrics is available 48-96 hours after online publication and is updated daily on week days.
Initial download of the metrics may take a while.