Fig. 5.
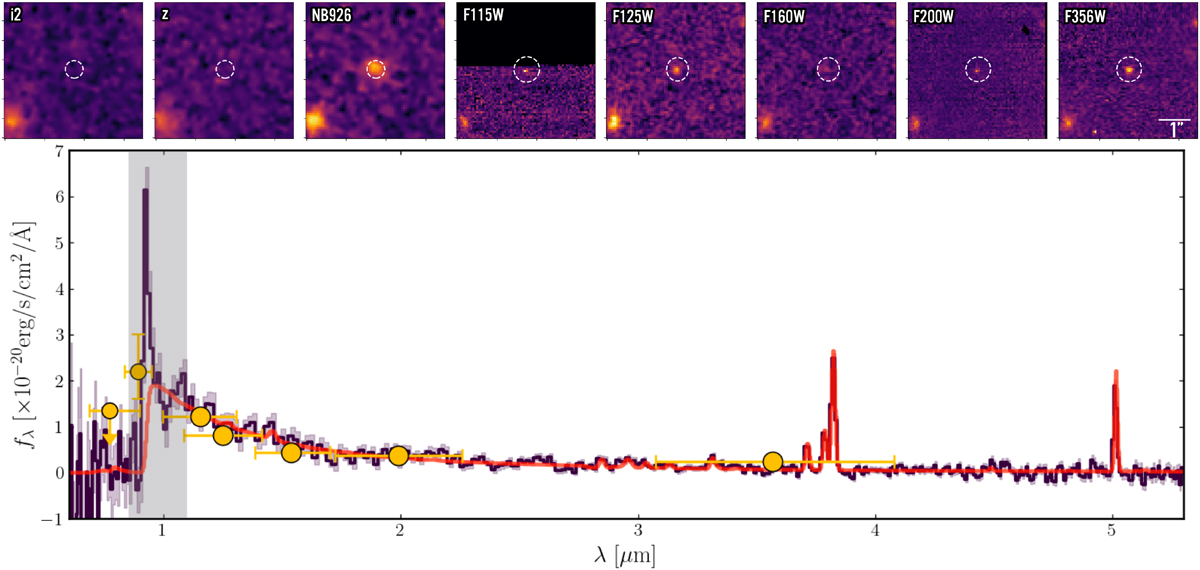
Download original image
(upper) Imaging of LAE-11 in all available bands across Subaru/HSC, HST/WFC3 and JWST/NIRCam, sorted by wavelength. The dashed white circle corresponds to the aperture used to measure the photometry in each filter. (lower) The observed NIRSpec PRISM spectrum and its 1σ uncertainty are depicted with a dark purple line and purple shaded region, the observed photometry with yellow points and the best-fitting SED model with a red line. The shaded grey region marks the masked Lyα emission line, which was excluded from the fitting process due to the limitations of the model.
Current usage metrics show cumulative count of Article Views (full-text article views including HTML views, PDF and ePub downloads, according to the available data) and Abstracts Views on Vision4Press platform.
Data correspond to usage on the plateform after 2015. The current usage metrics is available 48-96 hours after online publication and is updated daily on week days.
Initial download of the metrics may take a while.