Fig. 7.
Download original image
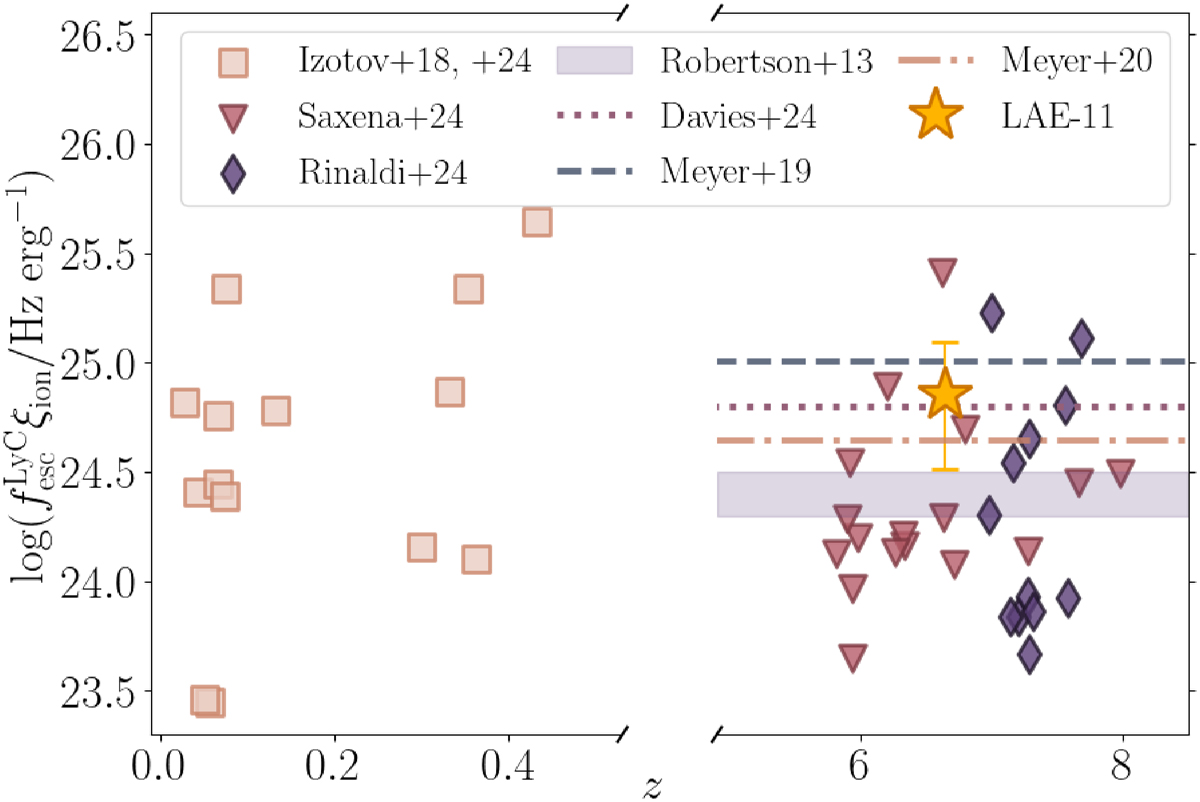
Evolution of the ionising output of galaxies (ξionfescLyC) with redshift. The ionising output required to sustain reionisation determined by Robertson et al. (2013) is depicted with shaded purple region, while the mean ionising output needed to maintain EoR adopted by Davies et al. (2024) is shown with a dotted pink line. The values determined by Meyer et al. (2019, 2020) are shown with a dashed blue and dashdotted pink lines. Low−z SFGs (Izotov et al. 2018, 2024) are shown with pale pink squares, high−z faint LAEs (Saxena et al. 2024) are shown with red triangles, high−z strong Hα emitters (Rinaldi et al. 2024) are shown with purple diamonds, and LAE-11 is depicted with a yellow star. We used the median fescLyC.
Current usage metrics show cumulative count of Article Views (full-text article views including HTML views, PDF and ePub downloads, according to the available data) and Abstracts Views on Vision4Press platform.
Data correspond to usage on the plateform after 2015. The current usage metrics is available 48-96 hours after online publication and is updated daily on week days.
Initial download of the metrics may take a while.