Open Access
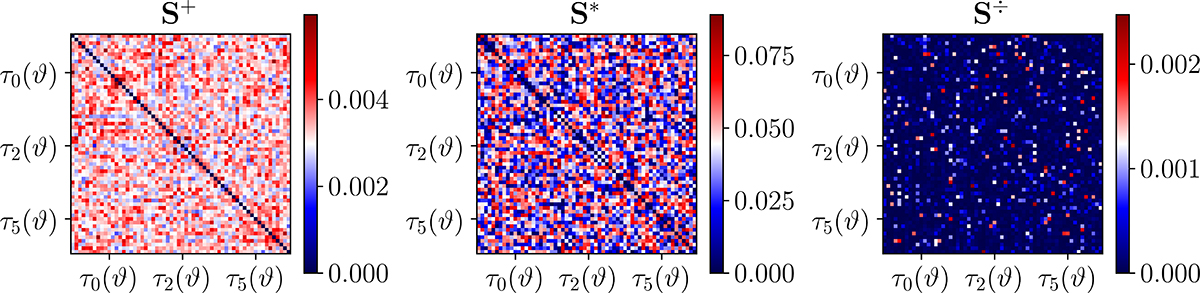
Fig. B.1.
Download original image
Transcovariance matrices S+, S* and S÷ obtained from the τ statistics samples from GLASS simulations. Each matrix coefficient (e, f) measures the amount of non-Gaussianity in the correlation between the e-th and the f-th entry of the data vector.
Current usage metrics show cumulative count of Article Views (full-text article views including HTML views, PDF and ePub downloads, according to the available data) and Abstracts Views on Vision4Press platform.
Data correspond to usage on the plateform after 2015. The current usage metrics is available 48-96 hours after online publication and is updated daily on week days.
Initial download of the metrics may take a while.