Open Access
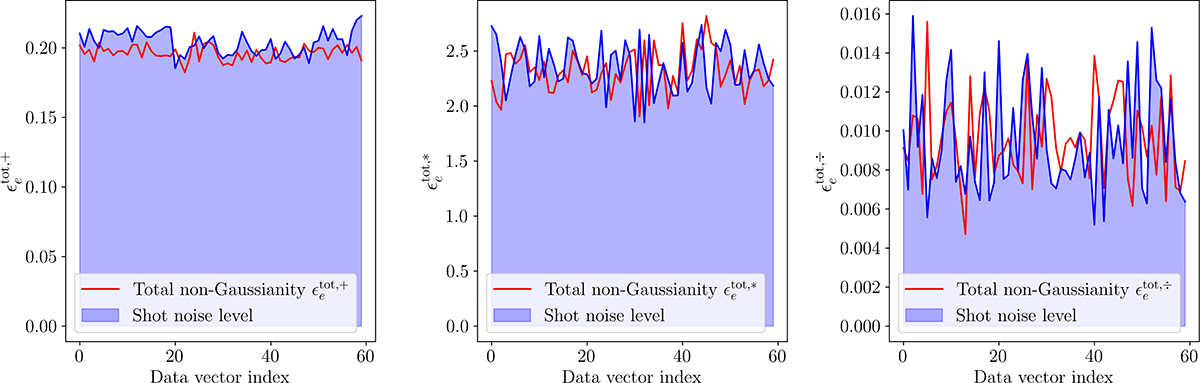
Fig. B.2.
Download original image
Total non-Gaussianity contamination at each entry of the data vector for each test. The blue region represents the shot noise due to the finite number of samples N and the limited amount of bins B. The red lines show the non-Gaussianity obtained for the τ statistics that are not significantly above the shot noise.
Current usage metrics show cumulative count of Article Views (full-text article views including HTML views, PDF and ePub downloads, according to the available data) and Abstracts Views on Vision4Press platform.
Data correspond to usage on the plateform after 2015. The current usage metrics is available 48-96 hours after online publication and is updated daily on week days.
Initial download of the metrics may take a while.