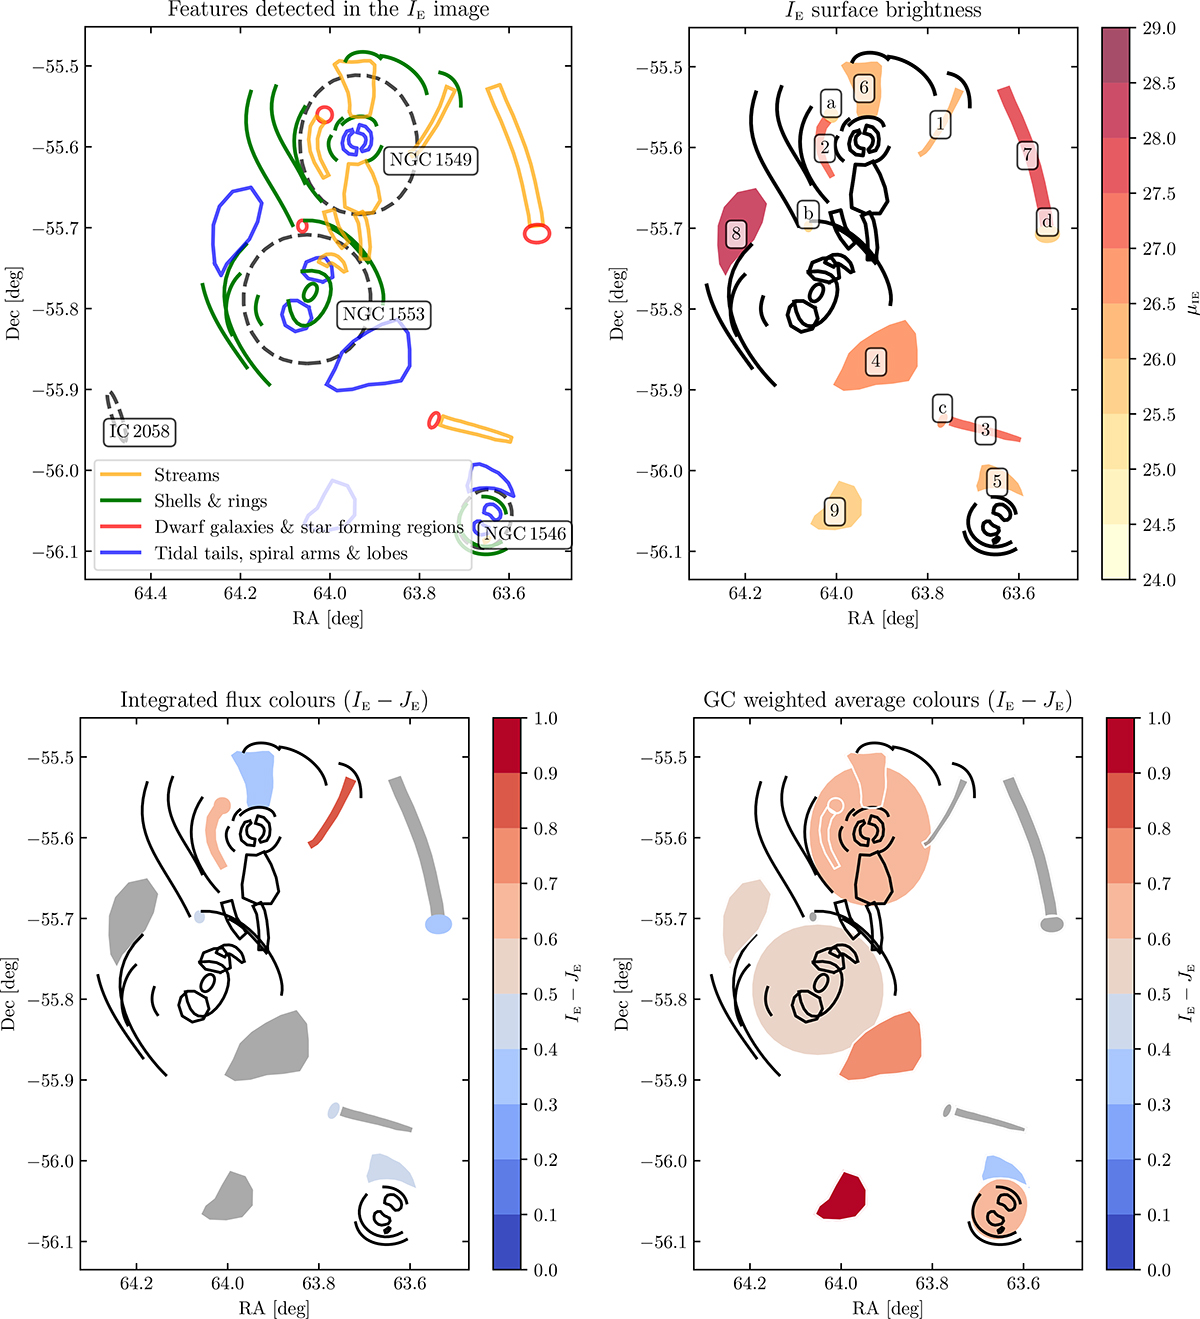
Fig. 12.
Download original image
Upper left: Features detected for each galaxy with the help of the IE images and residuals. Upper right: IE surface brightness map of the features. Those for which IE photometry can be performed are coloured according to their surface brightness and labelled. Their photometry is given in Table 5. They are discussed in the context of each galaxy they belong to in Sect. 4.2. Questions relative to their classification and nature are addressed in Sect. 5.1. Those for which this study is not possible are delineated in black. Especially, the photometry of the shells, of the uncertain features between NGC 1549 and NGC 1553, and of the features close to the galactic centres is not estimated. Lower left: IE − JE integrated fluxes colour map. The features with uncertain detection in the NIR bands appear in grey. Lower right: IE − JE GCs colour map. The average colours are weighted based on the uncertainties of the magnitudes that contribute to them. The features that encompass less than three bright GC candidates appear in grey. Surface brightness and colours are given respectively in mag arcsec−2 and in mag.
Current usage metrics show cumulative count of Article Views (full-text article views including HTML views, PDF and ePub downloads, according to the available data) and Abstracts Views on Vision4Press platform.
Data correspond to usage on the plateform after 2015. The current usage metrics is available 48-96 hours after online publication and is updated daily on week days.
Initial download of the metrics may take a while.