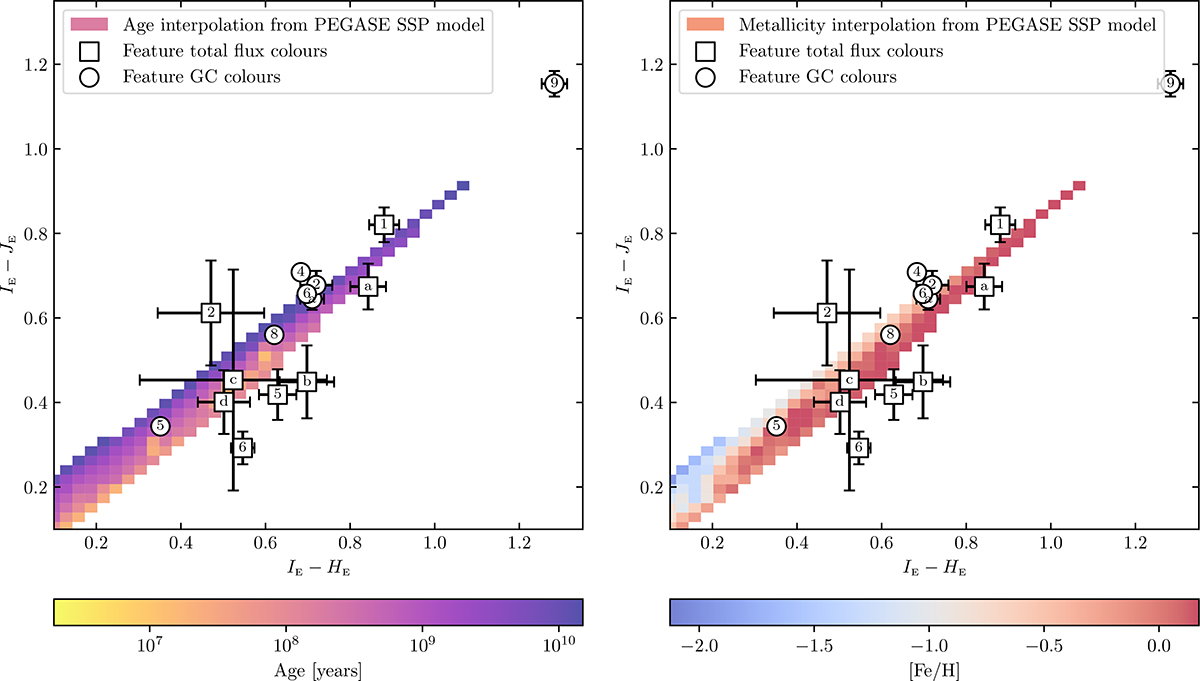
Fig. 13.
Download original image
Colour-colour plot of the ERO Dorado features, for both total flux photometry (square labels) and GCs photometry (round labels). The colours are given in magnitude. The interpolated metallicities and ages are obtained using the PEGASE (Le Borgne et al. 2004) single stellar population (SSP) model. However, the colour-coded area is consistent in age and metallicity across all the other SSP models tested. The feature labels are taken from Fig. 12. Their magnitude and colours are available in Table 5.
Current usage metrics show cumulative count of Article Views (full-text article views including HTML views, PDF and ePub downloads, according to the available data) and Abstracts Views on Vision4Press platform.
Data correspond to usage on the plateform after 2015. The current usage metrics is available 48-96 hours after online publication and is updated daily on week days.
Initial download of the metrics may take a while.