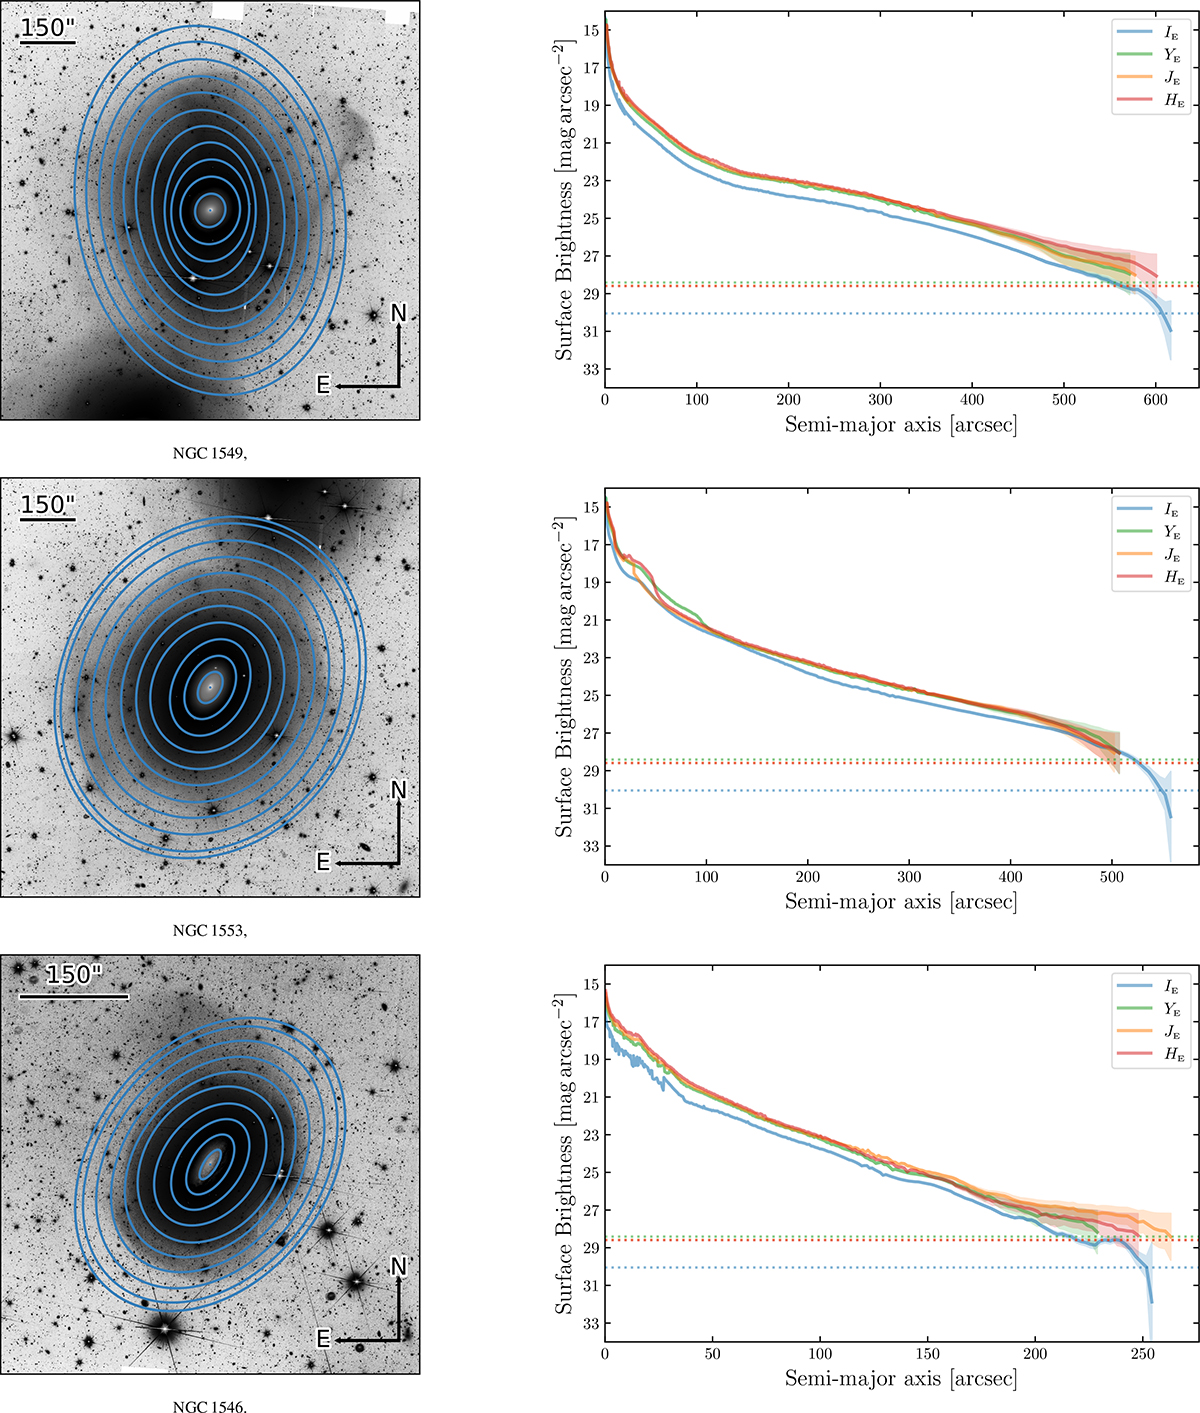
Fig. 8.
Download original image
Left: IE cutouts of the three galaxies of interest, displayed using hybrid histogram equalisation and logarithmic scale. Ellipses of the AutoProf profiles are displayed in blue. Right: Corresponding surface brightness profiles (solid lines) and their uncertainties (semi-transparent areas). The limiting surface brightness for extended emission on a 10″ × 10″ scale is taken from Cuillandre et al. (2025) and is shown as a dotted line for each band.
Current usage metrics show cumulative count of Article Views (full-text article views including HTML views, PDF and ePub downloads, according to the available data) and Abstracts Views on Vision4Press platform.
Data correspond to usage on the plateform after 2015. The current usage metrics is available 48-96 hours after online publication and is updated daily on week days.
Initial download of the metrics may take a while.