Fig. 9.
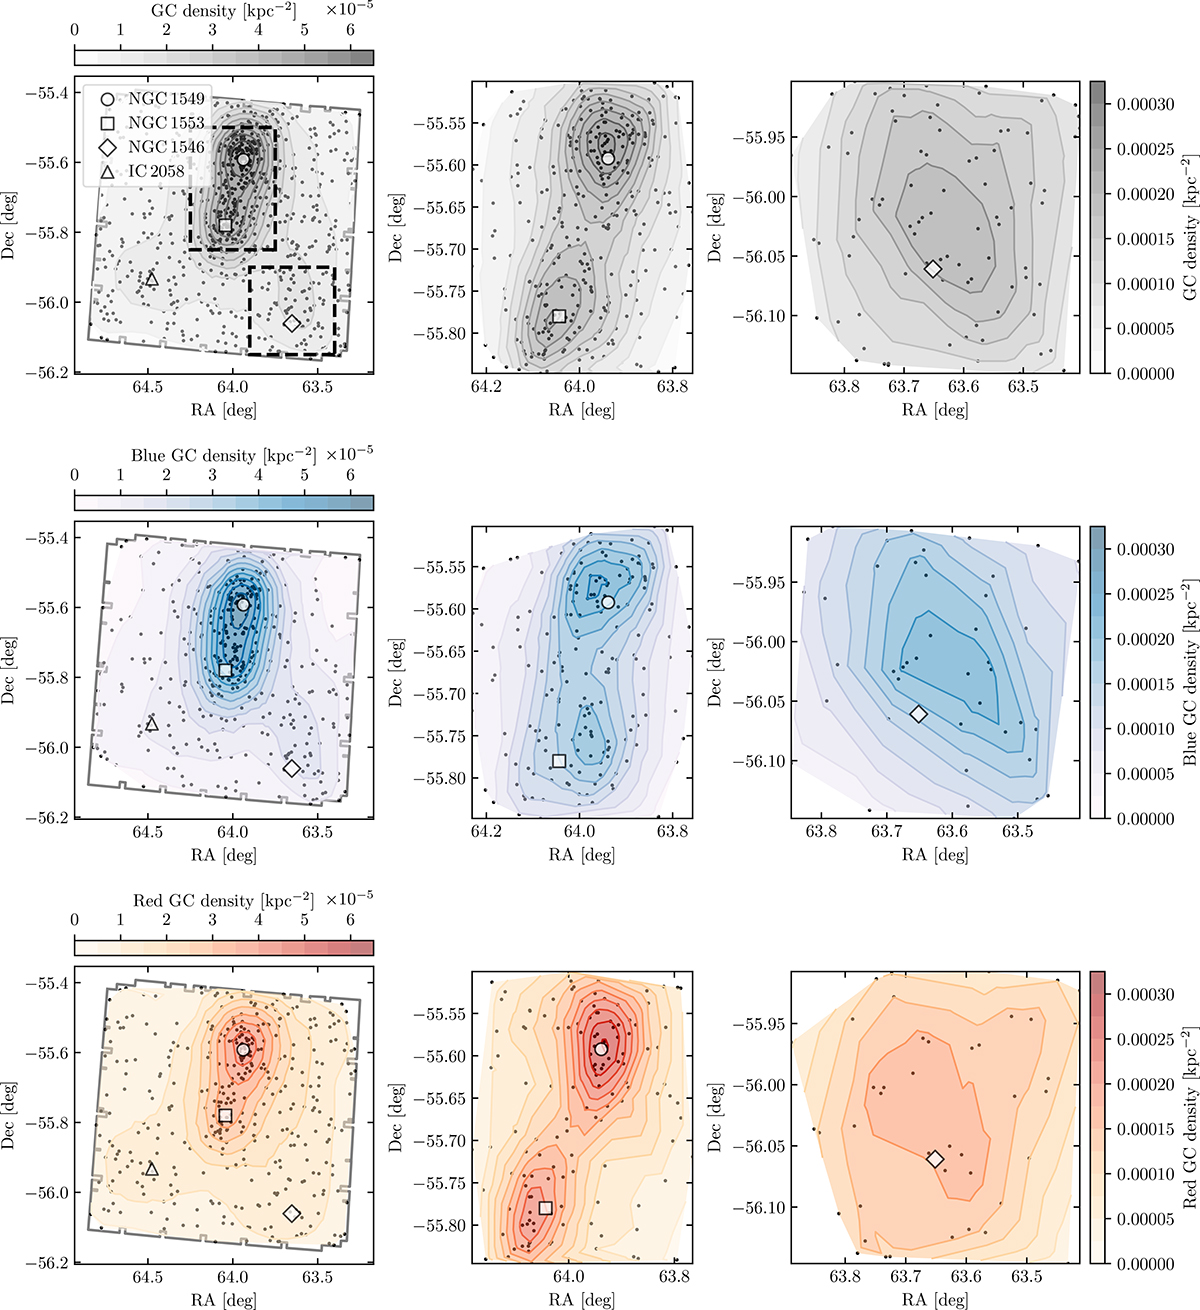
Download original image
Bright GC candidates density maps of the full ERO-D FoV (left column), with zooms on the NGC 1549-NGC 1553 pair (middle column), and on NGC 1546 (right column). The colour scale is the same for both zooms, where the density fields were re-evaluated locally using the samples within the cutouts. All GCs, blue GCs, and red GCs are represented in the upper, middle, and lower rows, respectively. Blue and red GCs are defined relative to the median IE − HE colour of the GC candidates, which is not indicative of an intrinsically bimodal population within our data.
Current usage metrics show cumulative count of Article Views (full-text article views including HTML views, PDF and ePub downloads, according to the available data) and Abstracts Views on Vision4Press platform.
Data correspond to usage on the plateform after 2015. The current usage metrics is available 48-96 hours after online publication and is updated daily on week days.
Initial download of the metrics may take a while.