Fig. 1.
Download original image
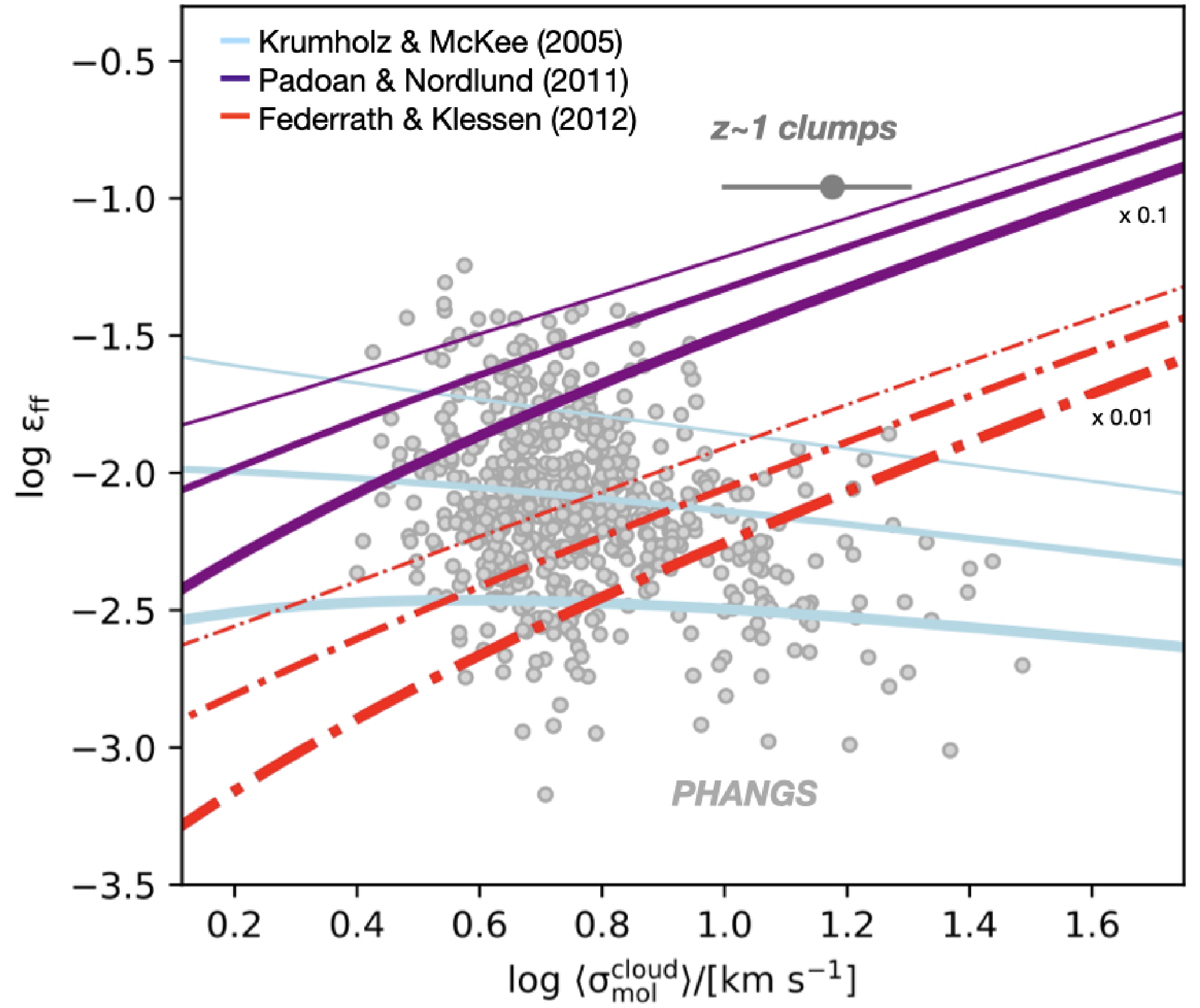
Time-average ϵff measured in 1.5-kpc-wide hexagonal apertures sampling throughout 67 nearby galaxies targeted by PHANGS, as measured by Leroy et al. (2025). Measurements are plotted against the average cloud-scale velocity dispersion ![]() in each aperture (Leroy et al. 2025; see Sun et al. 2022, 2023 for details). Representative values for the z ∼ 1 clumps examined by Dessauges-Zavadsky et al. (2023) are indicated by the thick gray point and bar, which depict the mean and rms of clumps velocity dispersions, respectively, at the 11% efficiency estimated for these clumps (Dessauges-Zavadsky et al. 2023). Colored lines illustrate the following basic predictions from turbulence-regulated SF models in SFF and MFF scenarios: Krumholz & McKee (2005) (KM05, SFF; blue), Padoan & Nordlund (2011) (PN11, SFF; purple, scaled down by a factor of 10) and Federrath & Klessen (2012) (FK12, MFF; red, scaled down by a factor of 100). Each model is shown at three values of the virial parameter αvir = 2.9, αvir = 5.3, and αvir = 9.7, the 16th, 50th, and 84th percentiles of the plotted regions, respectively. The linewidth of the trends increases with increasing virial parameter. All models adopt ϵcore = 0.5, b = 0.87, and ϕt = 1.9; sound speed cs = 0.3 km s−1 (see the main text for definitions of these quantities); and, for comparison, the same definition for the critical density, given by Eq. (4), estimated using the appropriate virial parameter for each line.
in each aperture (Leroy et al. 2025; see Sun et al. 2022, 2023 for details). Representative values for the z ∼ 1 clumps examined by Dessauges-Zavadsky et al. (2023) are indicated by the thick gray point and bar, which depict the mean and rms of clumps velocity dispersions, respectively, at the 11% efficiency estimated for these clumps (Dessauges-Zavadsky et al. 2023). Colored lines illustrate the following basic predictions from turbulence-regulated SF models in SFF and MFF scenarios: Krumholz & McKee (2005) (KM05, SFF; blue), Padoan & Nordlund (2011) (PN11, SFF; purple, scaled down by a factor of 10) and Federrath & Klessen (2012) (FK12, MFF; red, scaled down by a factor of 100). Each model is shown at three values of the virial parameter αvir = 2.9, αvir = 5.3, and αvir = 9.7, the 16th, 50th, and 84th percentiles of the plotted regions, respectively. The linewidth of the trends increases with increasing virial parameter. All models adopt ϵcore = 0.5, b = 0.87, and ϕt = 1.9; sound speed cs = 0.3 km s−1 (see the main text for definitions of these quantities); and, for comparison, the same definition for the critical density, given by Eq. (4), estimated using the appropriate virial parameter for each line.
Current usage metrics show cumulative count of Article Views (full-text article views including HTML views, PDF and ePub downloads, according to the available data) and Abstracts Views on Vision4Press platform.
Data correspond to usage on the plateform after 2015. The current usage metrics is available 48-96 hours after online publication and is updated daily on week days.
Initial download of the metrics may take a while.