Fig. 3.
Download original image
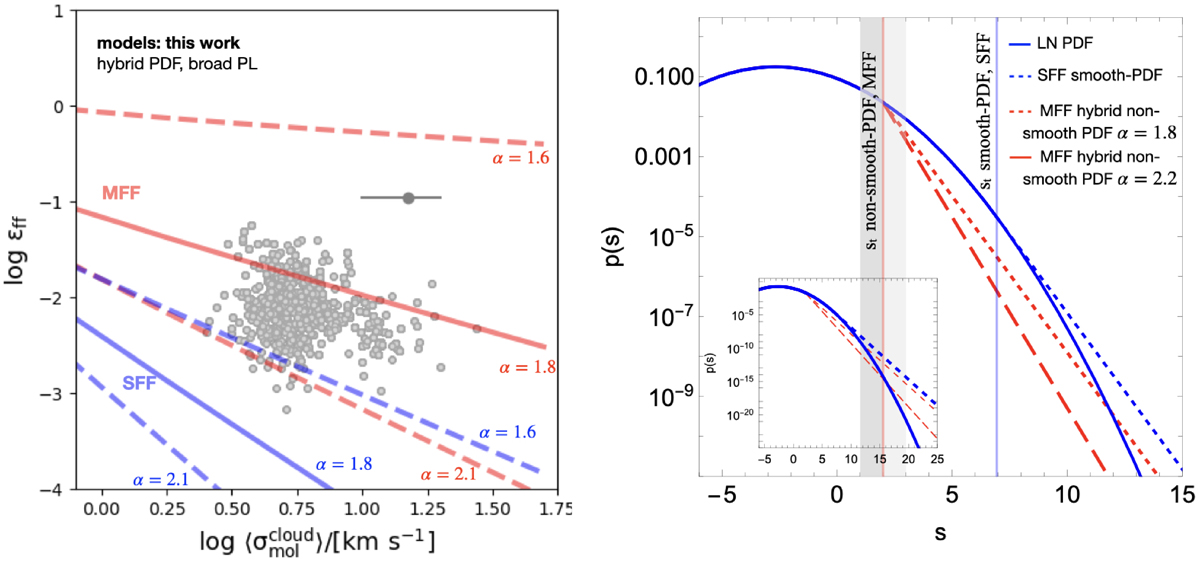
(Left) Predictions for ϵff from turbulence-regulated SF models with the hybrid LN+PL PDF proposed here (Eq. (32)) in the SFF (blue) or multi-free-fall (red) scenarios. In these hybrid PDFs, the transition from LN to PL behavior is set to the density threshold for gas to kinematically decouple from the galaxy (Meidt et al. 2020). A range of PL slopes 1.6 < α < 2.1 set to the range observed by Kainulainen et al. (2014) and Schneider et al. (2022) are indicated by the width of each band. As in Figure 2, here we set ϵcore = 0.5, ϕt = 1, αvir = 5, b = 0.87, and cs = 0.3 km s−1, and use the KM05 critical density in Eq. (4). Here we also adopt a fixed γ = 1. Light gray points show the PHANGS measurements from Leroy et al. (2025), and the dark gray bar and point depict the Dessauges-Zavadsky et al. (2023)z ∼ 1 clumps, repeated from Figure 1. (Right) Illustration of typical hybrid LN+PL density PDFs that can fit the observed ϵff. All cases adopt the average cloud-scale velocity dispersion ![]() km s−1, corresponding to ℳ = 16.7. The two red lines show the non-smooth hybrid PDFs that fit in a multi-free-fall scenario. (The non-smooth PDF required in SFF scenario is not shown.) These assume the same transition density ρt = ρG corresponding to st = 2 (red vertical line) but the dotted PL has a slope α = 1.7, and the dashed PL has a slope α = 2.2, selected to bracket the full range in ϵff covered by PHANGS (see left panel). The two blue lines represent either the SFF smooth hybrid PDF from Figure 2 (blue with a dashed line) or an LN-only PDF (solid blue). The vertical blue line marks the transition st = 6.9 for the former. The two gray vertical lines are as plotted in Figure 2. The inset at the bottom left shows all four PDFs over a larger dynamical range, highlighting the behavior at the very highest densities.
km s−1, corresponding to ℳ = 16.7. The two red lines show the non-smooth hybrid PDFs that fit in a multi-free-fall scenario. (The non-smooth PDF required in SFF scenario is not shown.) These assume the same transition density ρt = ρG corresponding to st = 2 (red vertical line) but the dotted PL has a slope α = 1.7, and the dashed PL has a slope α = 2.2, selected to bracket the full range in ϵff covered by PHANGS (see left panel). The two blue lines represent either the SFF smooth hybrid PDF from Figure 2 (blue with a dashed line) or an LN-only PDF (solid blue). The vertical blue line marks the transition st = 6.9 for the former. The two gray vertical lines are as plotted in Figure 2. The inset at the bottom left shows all four PDFs over a larger dynamical range, highlighting the behavior at the very highest densities.
Current usage metrics show cumulative count of Article Views (full-text article views including HTML views, PDF and ePub downloads, according to the available data) and Abstracts Views on Vision4Press platform.
Data correspond to usage on the plateform after 2015. The current usage metrics is available 48-96 hours after online publication and is updated daily on week days.
Initial download of the metrics may take a while.