Fig. 6.
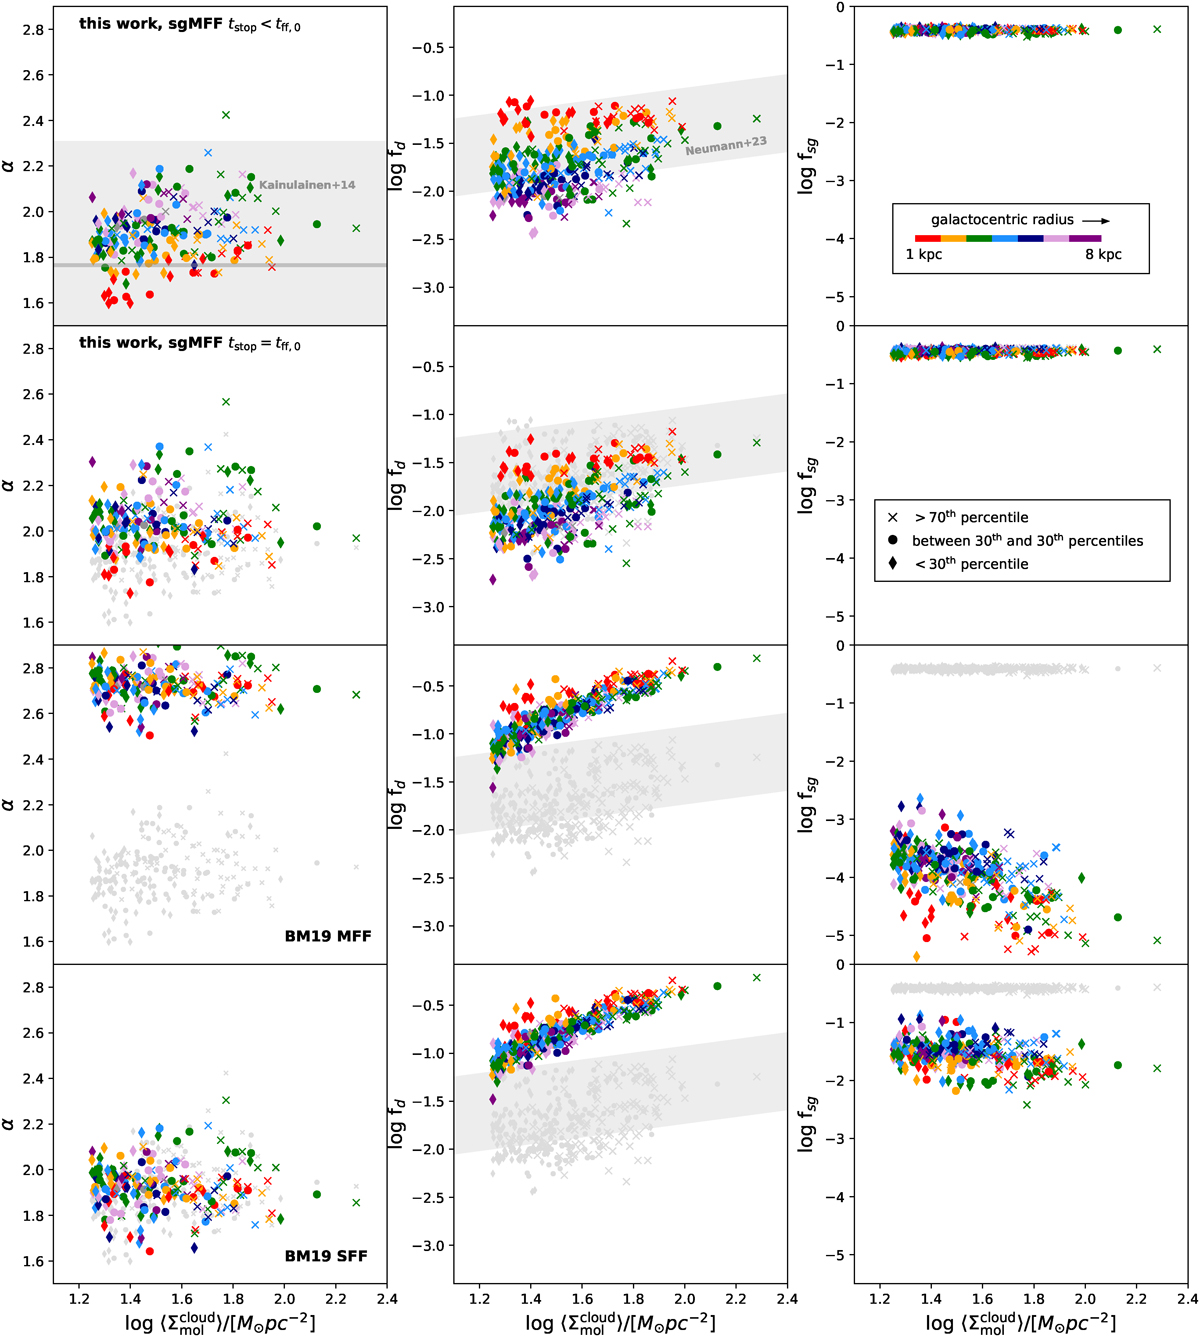
Download original image
Diagnostics of the hybrid LN plus PL density PDFs that match different MFF (and SFF) SF models to the ϵff values measured in PHANGS. From left to right: Slope of the PL component of the PDF α, the dense gas fraction fd measured above a fixed density threshold (see text), and the self-gravitating fraction fsg measured above the critical density scrit. The top row shows results for PDFs in the fiducial broad PL – the shortened duration model given in Eq. (32) – adopting an MFF scenario. The second row shows results for PDFs in the broad PL – full duration model with tobs = tstop in Eq. (32) also in the MFF scenario. The bottom two rows show MFF (third row) or SFF (fourth row) predictions adopting hybrid smooth-PDFs in the Burkhart formulation, with st = scrit advocated by Burkhart & Mocz (2019). All SF models shown here have assumed ϵcore = 0.5, ϕt = 1, b = 0.87, and cs = 0.3 km s−1, and the critical density given in Eq. (4). As indicated by the color bar in the top right panel, points are color-coded by galactocentric radius (increasing outward, from red to purple). The symbol style denotes relative gas surface density; in all radial bins, regions sitting below the 30th percentile are marked with diamonds, regions between the 30th and 70th are marked with a circle, and regions above the 70th percentile are marked with a cross. The gray points in the bottom row repeat the measurements from the top row. The horizontal gray line (band) in the top left panel shows the mean (full spread) of the PL slopes α observed in local clouds (Kainulainen et al. 2014). The gray band in the middle panels illustrates the relation between the dense gas fraction and the gas surface density fit by Neumann et al. (2023). The width of the band represents the full spread in the fitted data (roughly 3 times the scatter about the fit line).
Current usage metrics show cumulative count of Article Views (full-text article views including HTML views, PDF and ePub downloads, according to the available data) and Abstracts Views on Vision4Press platform.
Data correspond to usage on the plateform after 2015. The current usage metrics is available 48-96 hours after online publication and is updated daily on week days.
Initial download of the metrics may take a while.