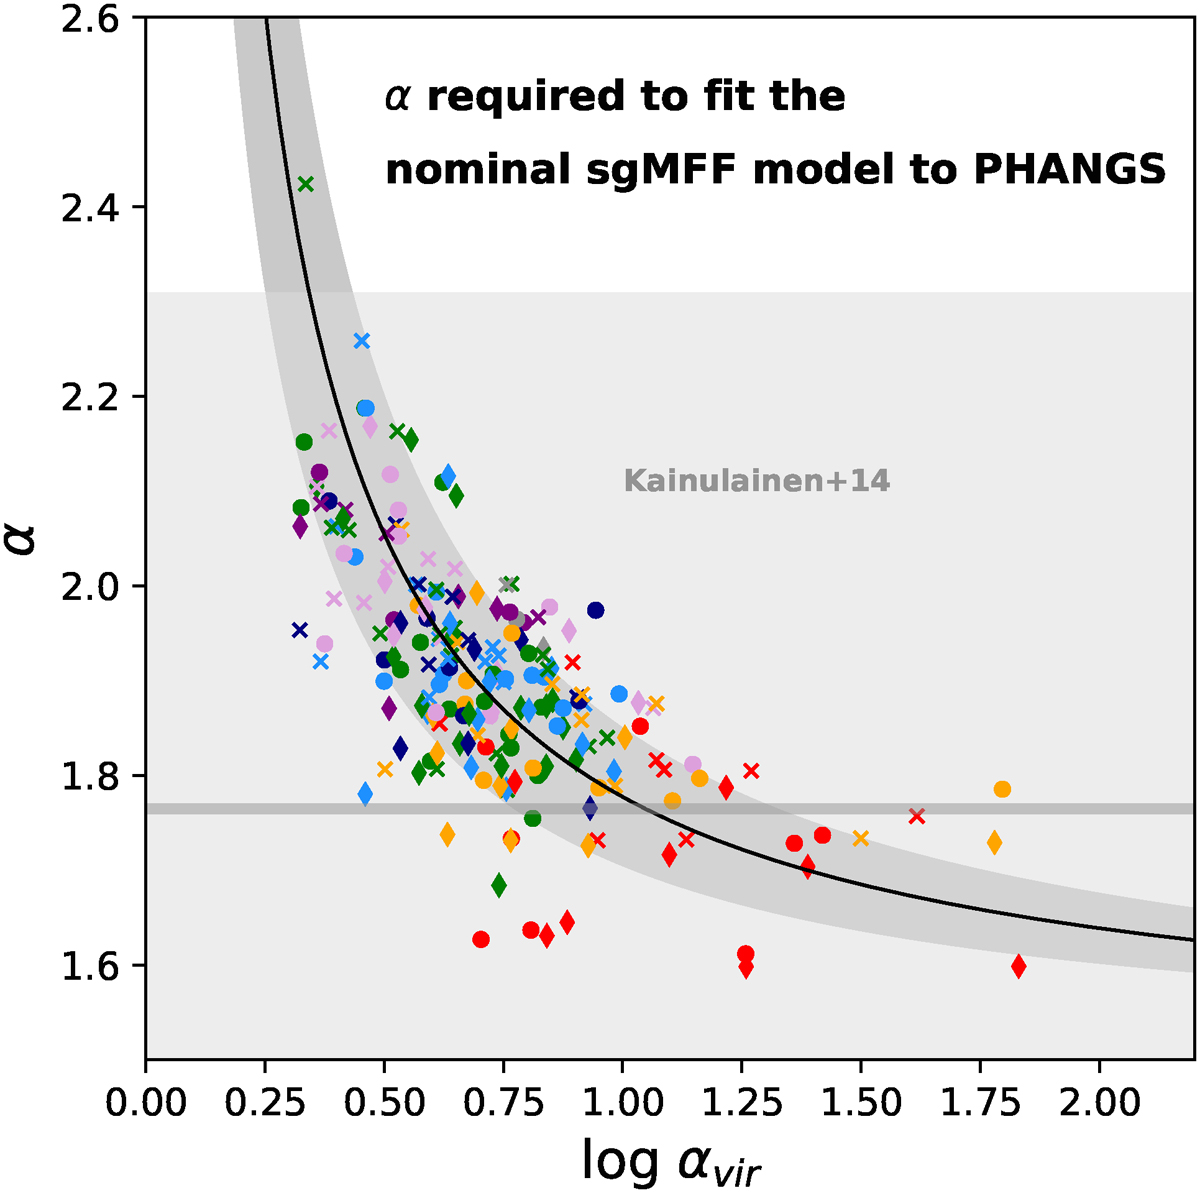
Fig. 7.
Download original image
Variation in the PL slope α calculated with the shortened duration model given in Eq. (32) as a function of the cloud-scale virial parameter αvir. Symbol shapes and colors are the same as in Figure 6. The horizontal gray line (band) shows the mean (full spread) of the PL slopes α observed in local clouds (Kainulainen et al. 2014). The reference line given by Eq. (35) with ℛα = 0.23 ± 0.06 is shown in black. Combining the systematic variation of dense gas fraction with virial state implied here together with variations in the critical density (depending on αvir) produces SF efficiencies that match the PHANGS observations in Fig. 1 (see also Fig. C.1 and the discussion in Sect. 6.6).
Current usage metrics show cumulative count of Article Views (full-text article views including HTML views, PDF and ePub downloads, according to the available data) and Abstracts Views on Vision4Press platform.
Data correspond to usage on the plateform after 2015. The current usage metrics is available 48-96 hours after online publication and is updated daily on week days.
Initial download of the metrics may take a while.