Fig. C.1.
Download original image
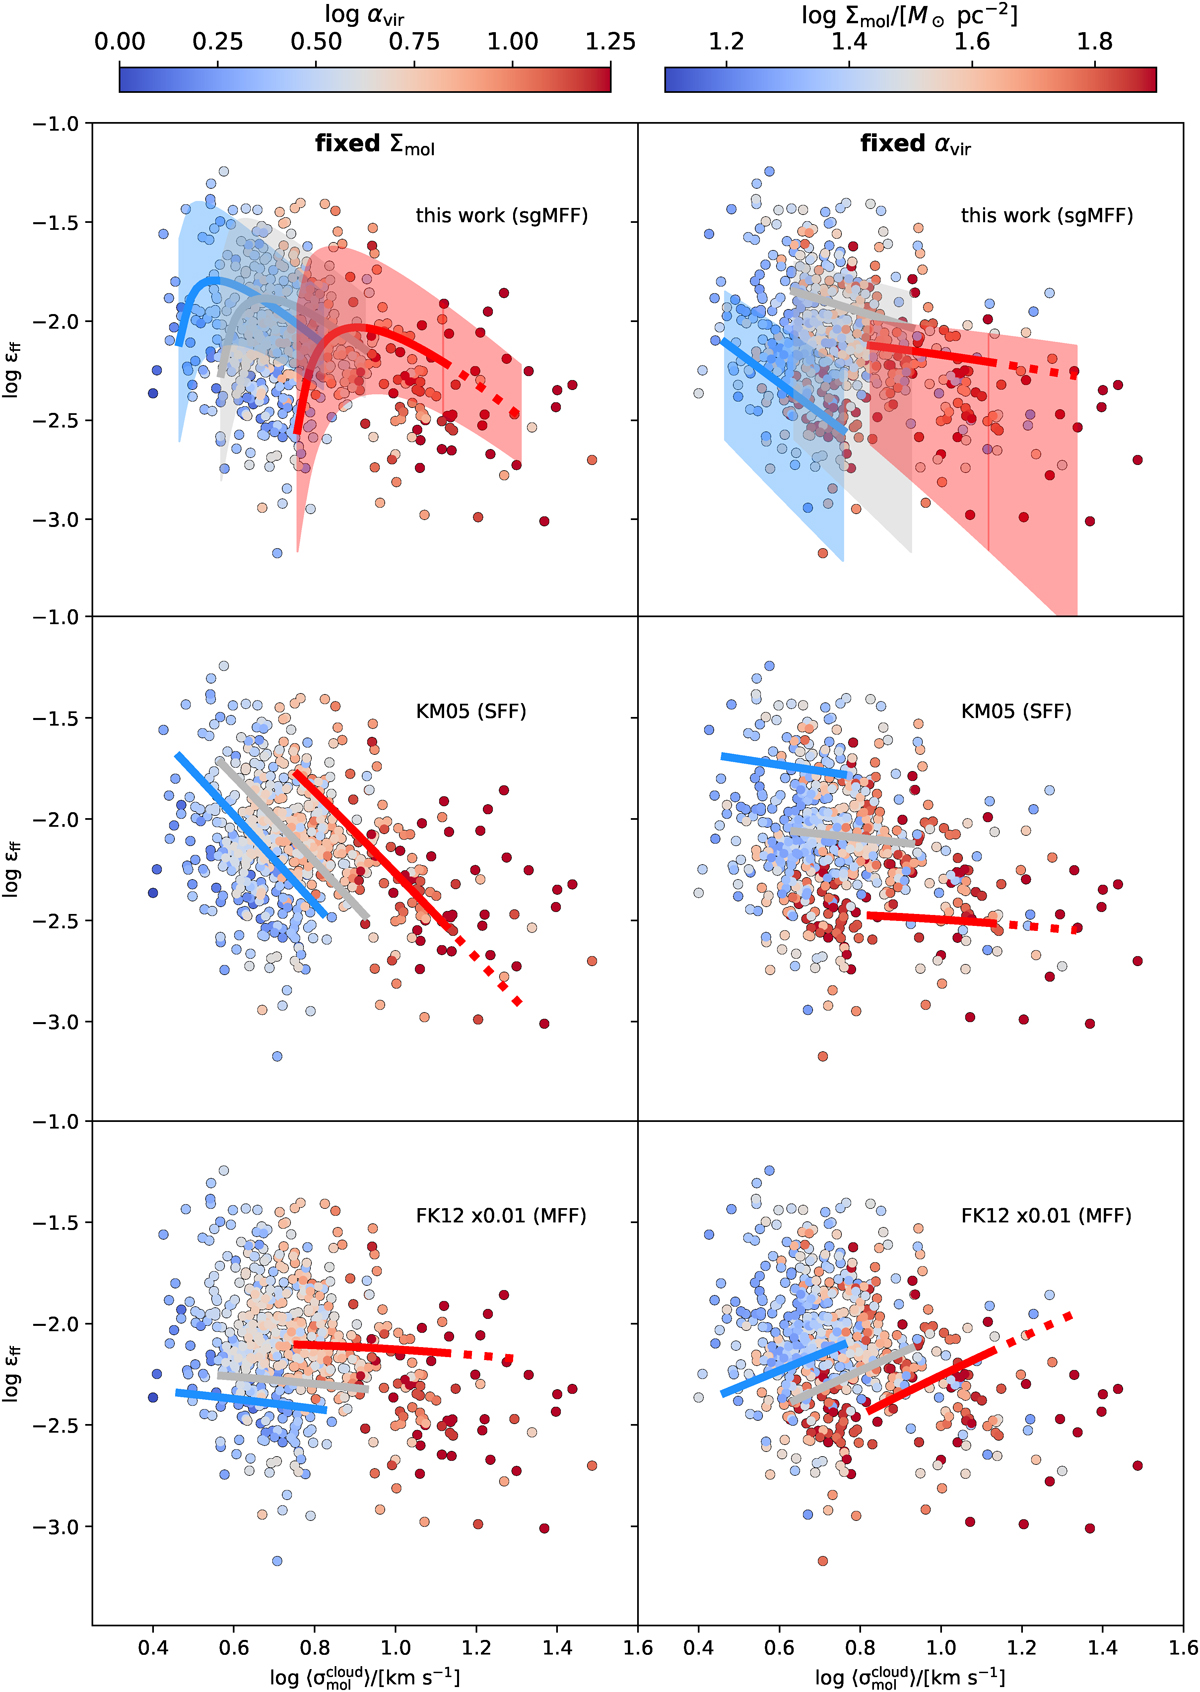
Comparison between three star formation models (top, middle, and bottom) and PHANGS measurements of the population-average ![]() in 1.5-kpc wide hexagonal apertures (see Figure 1) plotted against the average cloud-scale velocity dispersion
in 1.5-kpc wide hexagonal apertures (see Figure 1) plotted against the average cloud-scale velocity dispersion ![]() in each aperture (see text). In the left (right) panels, measurements are color-coded by
in each aperture (see text). In the left (right) panels, measurements are color-coded by ![]() (⟨αvir⟩) and shown alongside lines illustrating fixed-Σ (fixed-αvir) predictions from turbulence-regulated SF models at three representative values of Σ (αvir) (see text). As in Figure 1, all models adopt ϵcore = 0.5, b = 0.87; the gas sound speed, cs = 0.3 km s−1 (see the main text for definitions of these quantities); and, for comparison, the same definition for the critical density, given by Eq. (4).
(⟨αvir⟩) and shown alongside lines illustrating fixed-Σ (fixed-αvir) predictions from turbulence-regulated SF models at three representative values of Σ (αvir) (see text). As in Figure 1, all models adopt ϵcore = 0.5, b = 0.87; the gas sound speed, cs = 0.3 km s−1 (see the main text for definitions of these quantities); and, for comparison, the same definition for the critical density, given by Eq. (4).
Current usage metrics show cumulative count of Article Views (full-text article views including HTML views, PDF and ePub downloads, according to the available data) and Abstracts Views on Vision4Press platform.
Data correspond to usage on the plateform after 2015. The current usage metrics is available 48-96 hours after online publication and is updated daily on week days.
Initial download of the metrics may take a while.