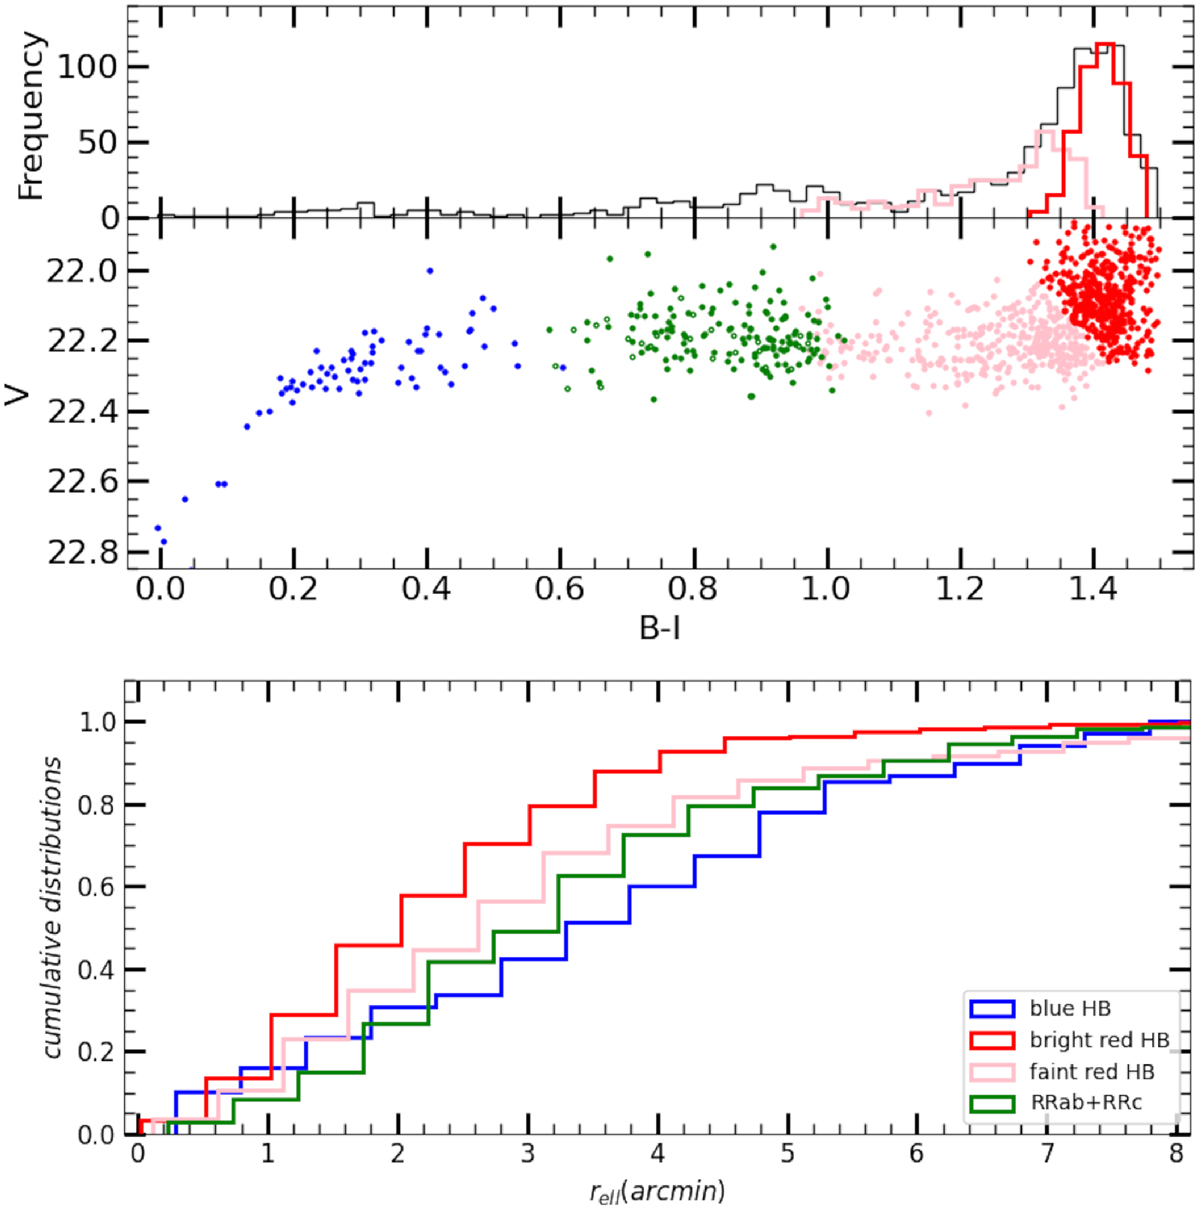
Fig. 8.
Download original image
Top: (V, B − I) CMD illustrating the selection of blue HB (blue points), red HB (pink), and red clump stars (red). The RRLs are plotted as green circles. The upper portion of the top panel shows the colour histogram of the pink, red, and full sample (in black). Bottom: Cumulative distribution vs the galactocentric radius of the four HB subsamples. This indicates that the redder the component, the higher the central concentration.
Current usage metrics show cumulative count of Article Views (full-text article views including HTML views, PDF and ePub downloads, according to the available data) and Abstracts Views on Vision4Press platform.
Data correspond to usage on the plateform after 2015. The current usage metrics is available 48-96 hours after online publication and is updated daily on week days.
Initial download of the metrics may take a while.