| Issue |
A&A
Volume 700, August 2025
|
|
|---|---|---|
| Article Number | A201 | |
| Number of page(s) | 17 | |
| Section | Extragalactic astronomy | |
| DOI | https://doi.org/10.1051/0004-6361/202453567 | |
| Published online | 21 August 2025 | |
Variable stars in Local Group galaxies
VII. New insights into the Leo II dSph
1
INAF-Osservatorio Astronomico di Roma, Via Frascati 33, 00078 Monte Porzio Catone, Italy
2
IAC-Instituto de Astrofísica de Canarias, Calle Vía Lactea s/n, E-38205 La Laguna, Tenerife, Spain
3
Departmento de Astrofísica, Universidad de La Laguna, E-38206 La Laguna, Tenerife, Spain
4
INAF-Osservatorio Astronomico d’Abruzzo, Via Mentore Maggini s.n.c., 64100 Teramo, Italy
5
International Gemini Observatory/NSF NOIRLab, 670 N. A’ohoku Place, Hilo, Hawai’i 96720, USA
6
INFN, Sezione di Pisa, Largo Pontecorvo 3, 56127 Pisa, Italy
7
Herzberg Astronomy and Astrophysics, National Research Council, 5071 West Saanich Road, Victoria, British Columbia V9E 2E7, Canada
8
INAF-Osservatorio Astronomico di Capodimonte, Via Moiariello 16, 80131 Naples, Italy
9
Department of Physics, Universitá di Roma Tor Vergata, Via della Ricerca Scientifica 1, 00133 Roma, Italy
10
Florida State University, Department of Physics, 77 Chieftain Way, Tallahassee, FL 32306, USA
⋆ Corresponding author: This email address is being protected from spambots. You need JavaScript enabled to view it.
Received:
20
December
2024
Accepted:
12
May
2025
Abstract
Aims. Pulsating variable stars are invaluable tracers for reconstructing the star formation history and chemical evolution of their host galaxies. In this work, we explore the variable star population of Leo II, a distant dwarf spheroidal satellite of the Milky Way.
Methods. We analyse an extensive dataset of ground-based BVRI time-series photometry spanning over 35 years. By examining the properties of RR Lyrae stars, we constrain the early chemical enrichment and spatial variation within Leo II. Additionally, we investigate the anomalous Cepheids in order to connect their characteristics with the galaxy’s prolonged star formation history, as revealed by deep HST/WFC3 colour–magnitude diagrams.
Results. We identified and characterised 175 variable stars, with all but one associated with Leo II. Our work includes the discovery of 25 new RR Lyrae stars and two new anomalous Cepheids. Moreover, we reclassified V88 as a BL Her variable star. By employing multiple independent methods, including metallicity-luminosity relations for RR Lyrae stars and period–luminosity and period–Wesenheit relations for both RR Lyrae and anomalous Cepheids, we derived a true distance modulus of (m − M)0 = 21.60 ± 0.03 mag, corresponding to 209 ± 4 kpc. Furthermore, we discuss potential formation scenarios for anomalous Cepheids and suggest that, despite the extended star formation history, they are all compatible having originated from old binary stars, with no contribution from young, evolved single stars.
Key words: stars: variables: Cepheids / stars: variables: RR Lyrae / galaxies: individual: Leo II / Local Group / galaxies: stellar content
© The Authors 2025
 Open Access article, published by EDP Sciences, under the terms of the Creative Commons Attribution License (https://creativecommons.org/licenses/by/4.0), which permits unrestricted use, distribution, and reproduction in any medium, provided the original work is properly cited.
This article is published in open access under the Subscribe to Open model. This email address is being protected from spambots. You need JavaScript enabled to view it. to support open access publication.
1. Introduction
Local Group (LG) dwarf galaxies present a remarkable variety of star formation histories (SFHs), as determined through colour–magnitude diagram (CMD) fitting techniques (e.g. Tolstoy et al. 2009; Gallart et al. 2015). Globally, the general trend is such that predominantly old, gas-poor, dwarf spheroidal (dSph) galaxies are located closer to the mass-dominant systems, that is the Milky Way (MW) and M31. In contrast, gas-rich, irregular systems with extended SFHs are preferentially located in the outskirts of the LG. This morphology–density relation has been explained invoking gas stripping of initially gas-rich galaxies when they were accreted by massive galaxies early in their history (Mayer 2010).
However, a number of outliers challenge this global picture: obvious examples are the Magellanic Clouds, the closest dwarf irregular systems, but there are also examples of isolated dSphs such as Cetus and Tucana (D’Onghia et al. 2009). Detailed SFHs derived from deep CMDs reaching well below the old main sequence turn-off (TO, Gallart et al. 2015) suggest that the formation environment is crucial to the subsequent evolution of dwarf systems (Skillman & Bender 1995). This, in turn, suggests that systems formed in lower-density environments tend to have more prolonged star formation activity.
Indeed, gravitational interactions have proven to be effective channels to alter the evolution of galaxies at all scales. In recent years, space missions such as Gaia and the Hubble Space Telescope (HST) greatly enhanced the orbital determination of nearby galaxies (e.g. Sohn et al. 2017; Battaglia et al. 2022), highlighting the possibility to connect them to detailed life-time SFHs and infer the environmental effect. Recently, Ruiz-Lara et al. (2021) explained that the sudden halt in star formation in Leo I is consistent with the epoch of the last pericentric passage. On the other hand, Rusakov et al. (2021) proposed that interaction with the MW was the triggering factor for the recent bursts of star formation in Fornax.
Notably, interesting examples of systems with remarkably different evolutionary histories are present in the outskirts of the MW halo. Eridanus II (Simon et al. 2021; Gallart et al. 2021) is characterised by an extremely old stellar population (> 13 Gyr) that formed in a burst possibly as short as 100 Myr and was strongly influenced by internal mechanisms such as supernovae feedback (Gallart et al. 2021). At the other extreme, Leo T presents prolonged star formation at all epochs (Weisz et al. 2012; Clementini et al. 2012) and was able to keep part of its gas until the present time. These two systems have a similar current stellar mass of the order of 105 M⊙. Moreover, the most recent orbit determination obtained based on Gaia DR3 data supports the idea that the two systems spent most of their life in isolation. Despite these similarities, the reasons for their completely different evolution paths are yet to be explained.
In this context, pulsating variable stars provide independent constraints for investigating the SFH of the host galaxies. In particular, RR Lyrae (RRL) stars and classical Cepheids (CCs) trace the extremes of the age range – older than 10 Gyr and between ∼100 and ∼300 Myr, respectively (Walker 1989; De Somma et al. 2020). As their pulsational properties depend on the properties of the stars (mass, metallicity), they are excellent tracers of the properties of the parent population they belong to. In particular, stars that we identify today as RRLs formed during the infancy of their host systems and thus provide direct insight into the physical conditions at early times.
Other interesting types of variable stars populate the same instability strip (IS), located between RRL stars and CCs (Monelli & Fiorentino 2022; Bono et al. 2024). Anomalous Cepheids (ACs) are ≈0.5–2.5 mag brighter than RRL stars and only form in metal-poor environments (Fiorentino et al. 2006; Ripepi et al. 2024). The most interesting property of this class of variables is that ACs can form through two different channels. They can be the descendants of binary stars (in which case they trace the old population) or result from the evolution of single stars with initial masses lower than ∼2.2 M⊙ (thus tracing an intermediate-age population, 1–6 Gyr old). Type II Cepheids encompass three sub-groups (BL Her, T Tau, and W Vir) – which differ by both evolutionary status and pulsation properties – but are typically used as tracers of the old population (Bono et al. 2020).
This paper focuses on the variable stars and stellar populations of the MW dSph satellite, Leo II. Leo II belongs to the small group of distant satellites above 200 kpc. Discovered by Harrington & Wilson (1950), it has been investigated in many early studies (Hodge 1962; Demers & Harris 1983; Aaronson et al. 1983), which promptly disclosed its predominantly old stellar content and its remarkably small ellipticity. Deep CMDs (Mighell 1997; Komiyama et al. 2007; Muñoz et al. 2018a) confirmed the size and structure of Leo II, as well as the presence of composite stellar populations, as demonstrated, for example, by complex HB morphology and its spatial gradient. Spectroscopic studies (Koch et al. 2007; Bosler et al. 2007; Kirby et al. 2010, 2011) agree on a relatively metal-poor mean metallicity, close to [Fe/H] ∼ −1.7 dex, with a large dispersion – possibly larger than 1 dex – and slow chemical enrichment as a function of age (Shetrone et al. 2009). Interestingly, evidence for the knotty presence of substructures has been provided by various authors (Komiyama et al. 2007; Spencer et al. 2017; Lora et al. 2019). Given its current distance, Leo II’s orbit is not yet firmly constrained. Initial attempts based on HST data (Lépine et al. 2011) suggested that Leo II is bound to the MW, though they could not place strong constraints to the orbit. The inclusion of Gaia data has triggered the homogeneous determination of proper motion for most LG galaxies (Fritz et al. 2018; Li et al. 2021; McConnachie & Venn 2020a). Battaglia et al. (2022) estimated that the last pericentric passage of Leo II occurred ∼3 Gyr ago, in broad agreement with the features of the SFH (Bennet et al. 2024). Nevertheless, various authors have discussed the importance of including the effect of the Large Magellanic Cloud (LMC) on the global potential on the orbital parameter determination for Leo II as well as for many LG dwarfs (Battaglia et al. 2022; Pace et al. 2022). Finally, it is worth noting the possibility that Leo II is either part of a vast polar structure formed by most classical MW satellites Pawlowski et al. (2013), Piatek et al. (2016) or that it recently reached the MW with a small group of galaxies (Leo IV, Leo V, Crater I, Torrealba et al. 2016; Júlio et al. 2024).
Variable stars in Leo II were first mentioned by Swope (1967, 1968), but the only dedicated work was presented by Siegel & Majewski (2000). They reported 148 RRL stars1 and four ACs. Their analysis focused on the global properties of RRL stars, pointing to an Oosterhoff intermediate type for Leo II. Interestingly, they identified a small group of bright RRL stars compatible with having a lower metallicity than the bulk of the population, by a few tenths of dex. In the present work, we re-analyse and update the variable star content of Leo II, based on an extensive dataset of ground-based photometry. The paper is organised as follows: Sect. 2 presents the observational material used in our analysis. Sect. 3 discusses the classification and the properties of the detected variable stars. Sect. 4 focuses on the derivation of the distance to Leo II based on the pulsational properties of its variable stars. In Sect. 5, we discuss the stellar population properties, together with the connections between variable stars and SFH. Our conclusions and final remarks are discussed in the last section of this paper.
2. Data and data reduction
The data adopted in this work belong to the collection of homogeneous photometry by P. B. Stetson (Stetson 2000; Stetson et al. 2014)2 and consist of 2026 individual charge-coupled device (CCD) images, observed over 61 nights in 25 runs covering over 35 years by means of ten different telescopes and detectors. Fifty percent (75%) of the images had seeing better than 0.9″ (1.3″). Table 1 summarises the observing runs indicating the dataset name, observation dates, instrumentation(telescope/camera), the number of images for the UBVRI filter passbands, and the multiplicity of each configuration. The median (maximum) number of phase points per star is 133 (149), 94 (105), 17 (22), and 91 (131) for the B, V, R, and I bands, respectively.
Observations of Leo II.
The data reduction and calibration follow the same procedure explained in previous papers (e.g. Stetson et al. 2014; Martínez-Vázquez et al. 2016b). Instrumental magnitudes were derived using the DAOPHOT/ALLFRAME suite of routines (Stetson 1987, 1994), and later calibrated on the Landolt photometric system (Landolt 1973, 2009). Each of the 1797 calibrated CCD images has been individually zero-pointed to the same set of 1331 local standards. The median uncertainty of an image zero-point is 0.0022 mag, based on a median of 104 local standards per image. More specifically, the median uncertainties are 0.0022 mag in the B filter (380 images), 0.0018 mag in the V filter (473 images), 0.0014 mag in the R filter (17 images), and 0.0028 mag in the I filter (927 images) based on the rms residuals of the zero-point calculation for each image. No photometric calibration was possible for the few U images, which were in any case included in the ALLFRAME run.
These data have been complemented with deep HST images publicly available at the MAST-Mikulski Archive for Space Telescopes. The data consists of F555W and F814W images of two non overlapping WFC3/UVIS fields located next to the Leo II centre (Prog. ID 12304, P.I. J. Holtzmann). The data were reduced following standard procedures based on DAOPHOT/ALLFRAME and following Monelli et al. (2010). For the sake of uniformity, the photometry was calibrated to the Johnson system using a sample of over a hundred local standard stars by means of a linear colour equation.
2.1. Structural parameters
We obtained the structural parameters of Leo II following the methodology from Vivas et al. (2020) and Martínez-Vázquez et al. (2021) applied to the ground-based clean catalogue. We computed the components of a bivariate Gaussian distribution to the right ascension and declination coordinates of the clean Leo II photometric catalogue described above, using the routine fit_bivariate_normal in AstroML (Ivezić et al. 2014). The result of this analysis is shown in Figure 1, and the corresponding parameters together with their uncertainties are the following:
 (1)
(1)
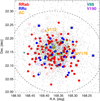 |
Fig. 1. Spatial distribution of 4742 Leo II stars selected according to their position, sharpness, and photometric error (0 < rell < 0.19 deg, |sharp|< 0.1 and sqrt(σB2 + σV2 < 0.07)). The red and blue circles show the locations of RRab and RRc type stars, respectively, with empty symbols indicating objects with poor light curves. The ACs are indicated as orange triangles, while V190, with uncertain classification, is highlighted with a purple diamond. V88, the likely BL Her variable star, is indicated with a dark green star. The black squares around the other symbols indicate newly discovered or re-classified variable stars. The solid and dashed ellipses indicate respectively the position of the half-light (2.46′) and tidal (9.82′) radii from Muñoz et al. (2018b), assuming the centre, position angle, and ellipticity derived in Sect. 2.1. The two green squares show the location of the two HST/WFC3 fields. |
where alpha and delta are the right ascension and declination of the centre of Leo II, epsilon is defined as 1 − b/a, and PA is the positional angle. The uncertainties of the parameters were derived using the bootstrap method, where we randomly selected 90% of the stars and derived the structural parameters of this reduced sample. This procedure was repeated 10 000 times. The errors reported comprise the standard deviation of the fitted parameters in those 10 000 experiments. The low value of the ellipticity is in excellent agreement with published values, all of which are close to 0.1 (Irwin & Hatzidimitriou 1995; Coleman et al. 2007; Muñoz et al. 2018b). Such a high level of circularity likely biases the derived value of the position angle, which has been reported as 7° (Coleman et al. 2007), 12° (Irwin & Hatzidimitriou 1995), 43° (Muñoz et al. 2018b), compared to our value of 72°. It is worth noting that the lowest values were derived with shallow photometry, while the two highest were determined based on the deep CMD reaching the subgiant level. In passing, we note that the published values of proper motion (Lépine et al. 2011; Piatek et al. 2016; McConnachie & Venn 2020b; Pace et al. 2022; Battaglia et al. 2022) provide typically negative values for both components, implying that Leo II is moving southwards and westwards, broadly in agreement with the semimajor axis direction.
2.2. Variable star detection and characterisation
The search for variable star candidates was performed on the ground-based data by means of an updated version of the Welch & Stetson (1993) algorithm. This process yielded 292 candidates. Periods were first estimated using a string-length algorithm (Stetson 1996), while inspecting individual light curves. This allowed us to clean the list of candidates from false detections, leaving a list of confirmed variable stars of 175 objects, 28 of which are new discoveries (V174–V201). The ID numbers follow the nomenclature by Siegel & Majewski (2000). As a second step, periods were cross-checked and fine-tuned with an interactive Interactive Data Language (IDL)-based programme (Bernard et al. 2009; Martínez Vázquez 2016), which also allowed us to estimate mean magnitudes and amplitudes by fitting templates (Layden et al. 1999).
Table 2 summarises the following main properties of the confirmed variable stars: ID, right ascension, declination, period, mean magnitude, and amplitude in the B, V, R, and I bands, respectively. Column 12 lists the metallicity, derived photometrically for the RRL stars as described in Sect. 5.2. Columns 13 and 14 report the type of variable and the pulsation mode. Lastly, column 15 provides a qualitative flag to distinguish stars with good (flag = 0, light yellow background in all light curve plots; see figures in the Appendix) or problematic light curves (flag = 1: noisy, high dispersion, incomplete phase coverage, etc., following our approach in Martínez-Vázquez et al. 2016b). This selection is adopted to define a ‘clean’ sample for estimating thedistance in Sect. 4. The time series photometry for all variable stars is shown in Table 3.
Properties of the variable stars in Leo II.
3. RR Lyrae and anomalous Cepheids
The confirmed stars were classified based on the period, light curve morphology, position on the colour–magnitude, Bailey diagrams (see Figures 2 and 3), location on the period–luminosity (PL) and period-Wesenheit (PW) planes (Figures 4, 5, and 6), as well as the comparison with theoretical models (see Sect. 5.4). We identify 167 RRL stars, six ACs, one BL Her star (V88), and one variable of uncertain classification (V190), as detailed in Table 4. Of the 28 new discoveries, 25 are RRL stars, two are ACs, while V190 remains uncertain – probably a field star along the line of sight.
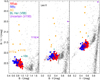 |
Fig. 2. From left to right: (B, B − I), (V, B − V), and (I, B − I) CMDs of Leo II with the analysed variable stars superimposed. The symbols are the same as in Figure 1. |
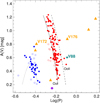 |
Fig. 3. Period-amplitude (Bailey) diagram for all the detected variable stars. |
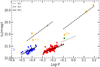 |
Fig. 4. De-reddened I0 magnitude vs. Log P for all the classified variables, compared to the PL relations for the ACs (dashed lines, from Ripepi et al. 2014a), the Type II Cepheids (dotted line, from Sicignano et al. 2024), and the RRLs (solid line, from Marconi et al. 2015). |
Time series in the B, V, R, and I filters.
Summary of the variable stars.
Of the 167 analysed RRLs, 122 are fundamental pulsators (RRabs), while 45 are first overtones (RRcs). The light curves are available in Figure A.1 of the Appendix A, and Table 5 summarises the mean magnitudes (BVRI) and the mean period of both RRab and RRc type stars.
Mean properties of the RRL stars.
Among the six ACs identified in Leo II (V53, V170, V171, V172, V176, and V188), V176 and V188 were detected for the first time. All their light curves are presented in Figure B.1.
The location of all the variable stars in the Leo II CMD is shown in Figure 2, which presents, from left to right, the (B, B − V), (V, B − I), and (I,V − I) planes, in the region of the horizontal branch (HB). In general, RRab (in red) and RRc (in blue) populate the expected region within the IS (black lines in the central panel from Marconi et al. 2015). However, we note that most of the outliers, especially in B − V, are flagged as stars with poor light curves (open circles). The ACs (orange triangles) cover the range in V magnitude from 21.70 to 20.33 mag, which is ∼0.520131.9 mag brighter than the RRL stars. The star with uncertain classification (V190, see its light curve in Figure C.1) is characterised by a small amplitude (ΔB ∼ 0.2 mag), and a colour redder than the IS. This might still be compatible with a more extinct AC. Nonetheless, the CMD of neighbouring stars does not show a systematic drift to a redder colour. It is therefore unlikely that V190 is a reddened AC belonging to Leo II, and we leave it unclassified.
Compared to Siegel & Majewski (2000), we miss six variable stars: three due to an insufficient number of points (V81, V83, and V86); one because of the noisy light curve that prevented us from deriving a reliable period (V93); and two probably due to blends with extended background objects (V16 and V111). The period of the 135 stars in common shows excellent agreement: the median period difference is 4.7 ⋅ 10−4 d, and 90% of the stars present a period difference less than 0.05 d.
The spatial distribution of variable stars is shown in Figure 1. We did not detect any variable star beyond the tidal radius of Leo II (dashed ellipse). Interestingly, new discoveries (empty squares around the coloured symbols) are spread throughout the main body of Leo II and are not limited to the outer, previously less-studied, regions. It is also worth noting that we performed a match with the variables available in the Gaia DR3 release. However, no objects were found in common, and Gaia did not provide new detections across Leo II’s body.
Figure 3 shows the period–amplitude (Bailey) diagram for all the variables stars. Superimposed are the lines corresponding to the loci of the Oosterhoff I and II globular clusters (solid and dashed lines on the RRab stars, Fabrizio et al. 2019). The distribution of Leo II’s RRab stars does not strictly follow either line, in agreement with the OOsterhoff intermediate classification noted by Siegel & Majewski (2000). Rather, they seem to follow a steeper relation when moving from shorter to longer periods, similar to the trend found by Martínez-Vázquez et al. (2017) in Carina, Cetus, and And III.
4. Distance to Leo II
A number of photometric studies derived the distance to Leo II by adopting different indicators. Using the tip of the red giant branch (RGB) as a standard candle, Bellazzini et al. (2005) found a true distance modulus (m − M)0 = 21.84 ± 0.13 mag, while Gullieuszik et al. (2008) found (m − M)0 = 21.68 ± 0.11 mag. By means of their PL relation for the ACs and the observational data by Siegel & Majewski (2000), Pritzl et al. (2002) derived (m − M)0 = 21.59 mag. In this section, we use pulsation properties of both RRL stars and ACs to constrain the distance to Leo II. For the RRL population, only variables with good light curves are used. This clean sample contains 103 RRab and 31 RRc.
MV–[Fe/H] – The first method we adopt is the linear formulation of the MV versus [Fe/H] relation recently published by Garofalo et al. (2022). This is based on the most recent and accurate parallaxes released by Gaia-EDR3 and the metallicity of 385 RRL stars in 15 globular clusters calibrated to the Carretta et al. (2009) scale. The relation, derived using a hierarchical Bayesian approach, takes the form, MV = 0.29 ⋅ [Fe/H] + 1.05, and is valid for [Fe/H] ranging from −2122.39 to 212−0.36 dex.
To apply it to Leo II, we assumed a metallicity value for its RRL stars. Various authors (e.g. Koch et al. 2007; Kirby et al. 2011; Shetrone et al. 2009; Lianou et al. 2011) estimated the metal content of this galaxy. Although calculated with different photometric or spectroscopic methods, there is homogeneity in the mean value, which ranges from −1.77 to −1.55 dex.
To apply the aforementioned relation, we assumed [Fe/H] = −1.74 dex (Carretta et al. 2009 scale, Koch et al. 2007), E(B − V) = 0.02 mag (Schlafly & Finkbeiner 2011), and ⟨V⟩ = 22.18 mag. This value was derived as the weighted mean apparent magnitude of all RRab and RRc pulsators. With these values we derived the distance modulus, (m − M)0 = 21.58 ± 0.05 mag, reported in Table 6, where the error is given by the mean absolute deviation around the median distance. This value is in very good agreement with the most recent estimates of Spencer et al. (2017). If we adopt the extremes of the quoted metallicity range, the distance modulus differs by 0.064 mag (from 21.643 to 21.580 mag, respectively); however, this difference is compatible with the dispersion observed.
Distance modulus to Leo II from its variable stars.
PL relations – The second method we applied uses PL relations in the I band (PLI). Figure 4 summarises the application of the PLI to both RRL stars (solid black lines, from Marconi et al. 2015) and ACs (dashed lines, from Ripepi et al. 2014a). The RRL stars provide a true distance modulus of 21.64 ± 0.09 mag, obtained by averaging the estimate from the RRab and RRc stars, with negligible dependence on the inclusion of flagged stars. While the use of the PLI for RRL stars is a well-established technique, the application to ACs is more recent. Indeed, the large sample of ACs in the Magellanic Clouds, observed in the Optical Gravitational Lensing Experiment (OGLE) survey (Soszyński et al. 2008, 2015), has also promoted the use of the PL and PW relations for this class of pulsators (Ripepi et al. 2014a; Groenewegen & Jurkovic 2017; Bhardwaj et al. 2024). For the present analysis, we used the relations by Ripepi et al. (2014a), assuming a distance of DMLMC = 18.477 mag to the Large Magellanic Cloud (Pietrzyński et al. 2019). The PLI of ACs provides a distance of 21.56 ± 0.09 mag, in good agreement with the RRL distance.
Figure 4 also shows that ACs pulsating in different modes follow different relations. In particular, V53, V170, and V176 fall under the fundamental mode sequence, while V171, V172, and V188 follow the RRc mode sequence.
PW relations – We took advantage of the multiple passbands available and adopted two PW relations for the RRL stars and one for the ACs, again assuming [Fe/H] = −1.74 dex. Figure 5 shows two applications of the W(I, V − I) (top) and W(V, B − V) (bottom) RRL Wesenheit relations from Marconi et al. (2015). In the left panels, the sample of RRL stars are kept separated in each pulsation mode, while in the right panels the RRc stars are fundamentalised by adding 0.127 to the logarithm of the periods (Braga et al. 2022). Again, the estimates obtained separately from the RRab and RRc samples were averaged. The values derived using the W(I, V − I) relation are marginally lower and in excellent agreement with the MV–[Fe/H] relation, than the distance derived with the W(V, B − V), which is very close to the distance based on the PLI relation.
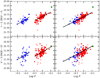 |
Fig. 5. PW plane for the RRL stars along with V88. The left column shows the RRab and RRc separately, while the RRc have been fundamentalised in the right column. The top and bottom panels indicate the (I, V − I) and (V, B − V) filter combinations. |
The case of ACs is illustrated in Figure 6, where the Ripepi et al. (2014b) (V, V − I) relations are used. The value derived, 21.58 ± 0.1 mag, is in excellent agreement with the estimate derived using the PLI from the same authors as well as with that from the RRL stars.
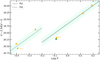 |
Fig. 6. (V, V − I) PW relation for the ACs, fitted by the PW relation provided by Ripepi et al. (2014a) for RRab and RRc AC pulsators. The shaded region accounts for the standard deviation of Leo II distance modulus (computed as in the text), the error on the adopted PW relation, and the assumed LMC distance. The position of V88 (star symbol) is also reported. |
Overall, by averaging previous results based on the RRL stars and ACs, and excluding V88, our estimate of the distance modulus of Leo II is ⟨(m − M)0⟩ = 21.60 ± 0.03 mag. On the other hand, contributors to the systematic errors include the reddening, the reddening law assumed in the Wesenheit relations, the metallicity, and, finally, the zero points of the theoretical or empirical relations adopted to derive the distance. These uncertainties are added in quadrature in order to define the total systematic error, amountingto 0.05 mag.
5. Stellar populations in Leo II
The left panel of Figure 7 shows the ground-based (V, V − I) CMD of Leo II, while the right panel shows the same CMD, but based on HST/WFC3 optical images. The ground-based plot includes stars with an elliptical distance from the Leo II centre less than 0.19 degrees (slightly greater than the tidal radius), selected according to the quality parameter sharpness (|sharp| < 0.1) and to the photometric error ( mag). We attempted to clean the CMD using Gaia DR3 proper motion and verified that the sample is limited to the brightest ∼300 stars in the top ≲2 mag of the RGB – well above the HB – thus not providing a substantial improvement. The HST/WFC3 CMD was only selected according to its sharpness (|sharp| < 0.1). Globally, the CMDs show the expected features for a predominantly old population, spanning from the tip of the red giant branch (V ∼ 19.2 mag) to well below the TO of the old population. Space-based photometry is, as expected, deeper and provides a better constrained comparison with theoreticalmodels.
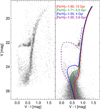 |
Fig. 7. (V,V − I) CMD of Leo II from both ground-based (left) and space observations (HST/WFC3, right). Selected isochrones for the BaSTI-IAC database are superimposed to the right panel. |
Indeed, in the right panel of Figure 7, we plotted selected isochrones from the BaSTI-IAC3 database (Pietrinferni et al. 2004; Hidalgo et al. 2018). One of the most interesting features is the luminosity spread of the subgiant branch, which is associated with an intrinsic age spread. The oldest and more metal-poor model accounts well for the red envelope of the TO region and the blue side of the RGB. Nonetheless, the blue side of the TO, as well as both the shape and slope of the subgiant branch, strongly support extended star formation until 5–6 Gyr ago. Moreover, the blue edge of the TO and the bright edge of the subgiant branch appear to be well defined, possibly due to a sudden halt in star formation. We note that such a quenching epoch is rather unusual among LG galaxies, despite the large diversity of SFHs (Tolstoy et al. 2009). Galaxies with extended star formation, even those classified as dSph, typically stopped forming stars in the last ∼2 Gyr (e.g. Fornax: del Pino et al. 2013; Rusakov et al. 2021; Leo I: Ruiz-Lara et al. 2021; and Leo T: Clementini et al. 2012; Weisz et al. 2012).
It is worth noting a small sequence of stars above the bulk of the population, which is compatible with a younger (∼4 Gyr, blue line) population. These results are in broad agreement with previous studies, such as the extended star formation inferred from wide-field Subaru data (Komiyama et al. 2007). A quantitative and detailed estimate of all these features also depend on the assumed metallicity and cannot be firmly constrained on the basis of this qualitative comparison. It will be the subject of a more sophisticated analysis based on CMD-fitting techniques.
On the other hand, the ground-based data allow for a better view of the bright portion of the CMD. The considerable difference in the area covered (over a factor 25) is reflected in the larger field contamination of the ground-based data. Nonetheless, the number of bright Leo II stars is a factor of 3 higher as well. Three features are worth noting: i) a well populated asymptotic giant branch (AGB), with the AGB clump standing out at (V − I, V) = (0.8, 21.4) mag; ii) the broad colour range covered by the HB; iii) the blue spur of the objects above the TO, typically associated with a population of blue stragglers (BSs), which seems to extend in luminosity until the HB level. Their bright magnitude questions their nature as BSs (see below).
5.1. Horizontal branch morphology and star formation history
The prolonged SFH of Leo II is apparent in the complexity of the HB (Figure 7, left panel). It confirms the well-known predominantly red morphology. Nonetheless, a clearly populated blue HB stands out as V − I ≲ 0.5 mag and can gets as blue as V − I ∼ 0 mag.
The plot clearly shows that the blue spur of the objects that are bluer and brighter than the TO of the intermediate and old population is a prominent feature in the ground-based photometry. For colours less than V − I ∼ 0.2 mag, the optical magnitude of HB stars begins to decrease due to the bolometric correction. In the case of Leo II, there is an interesting group of stars with 0 < V − I < 0.1 mag and 22.5 < V < 23 mag, which could be either blue HB stars or the brightest portion of the blue spur (Figure 8). Both scenarios are indeed interesting. In fact, HB stars reaching such high temperatures are common in massive globular clusters, but not in nearby dwarf galaxies (see, for example, the discussion in Momany et al. 2007). If, on the contrary, the plume of the blue objects extends to such high luminosities, two scenarios are possible. First, they could be single stars from a young component, with ages close to 900 Myr, as suggested by the isochrone comparison. Alternatively, they could be BSs, but in this case the mass, close to 1.8 M⊙, seems too high to correspond to the evolution of primordial low-mass binary system.
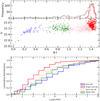 |
Fig. 8. Top: (V, B − I) CMD illustrating the selection of blue HB (blue points), red HB (pink), and red clump stars (red). The RRLs are plotted as green circles. The upper portion of the top panel shows the colour histogram of the pink, red, and full sample (in black). Bottom: Cumulative distribution vs the galactocentric radius of the four HB subsamples. This indicates that the redder the component, the higher the central concentration. |
Even more interesting is the red portion of the HB. For the first time in Leo II, current ground-based photometry clearly shows at least two over-densities, which are clearly visible in the (V, B − I) CMD (Figures 8 and 11). In particular, Figure 8 shows a zoomed-in view of the HB region of the CMD, where we highlighted four subsamples with different colours: the blue HB stars (blue), the RRL stars (green), the red HB stars (pink), and the red clump of redder and brighter stars (red). The selection of the red and pink sample was drawn by eye, as there is a clear separation between the two (see also Figure 11). The upper portion of the top panel shows the cumulative histogram (black), while the histograms for the red HB and the red clump stars are pink and red, respectively. The plot clearly shows the increase in sources when moving to the red side. Moreover, the red HB stars peak at B − I ∼ 1.35 mag, while a second, even stronger peak stands out at colour B − I∼ 1.43 mag. We argue that this bluer peak is composed by red HB stars from the old component, while the brighter and redder over-density is populated by red clump stars – descendants of the intermediate-age component – that is stars massive enough to ignite helium under partial electron degenerate conditions(see Figure 11).
5.2. Metallicity of the RRL stars and early chemical evolution
The first spectroscopic metallicity determination for Leo II was carried out by Suntzeff et al. (1986), who observed three red giant stars in this galaxy and measured [Fe/H] = −1.9 dex. Koch et al. (2007) presented spectroscopic metallicity measurements for 52 red giants finding an asymmetric metallicity distribution peaked at [Fe/H] = −1.74 dex on the Carretta et al. (2009) scale. More recent estimates, both spectroscopic and photometric (Kirby et al. 2011; Ross et al. 2015; Spencer et al. 2017), overall agree on values ranging from −1.55 down to −1.77, a distribution skewed to the metal poor side down to −2.4 dex, and a steeper decrease towards the metal-rich limit, close to −0.8 dex (Koch et al. 2007).
The pulsation properties of RRL stars depend on their metallicity. Therefore, different methods have been proposed to estimate individual metallicity from the light curve analysis (Jurcsik & Kovacs 1996; Alcock et al. 2000; Bono 2003). Here, we follow the inverse of the PLI relation (Braga et al. 2016; Martínez-Vázquez et al. 2016a). If the distance is known from an independent indicator, individual absolute magnitudes can be derived. Moreover, by inverting the PLI relation, one can calculate the metallicity of each star. If the distance cannot be determined independently, the metallicity distribution derived with the PLI will be on an arbitrary scale, with its shape nonetheless conserved. In particular, the metallicity spread does not depend on the assumed distance, and it is therefore a solid prediction of this method. In this case, we took advantage of B, V, and I photometry, and adopted the distance from the metal-independent W(V, B − V), 21.64 ± 0.08 mag (see Martínez-Vázquez et al. 2015, 2016a,b; Monelli et al. 2018). This also has the advantage that, given the very little dependency of this particular relation on the metallicity (Marconi et al. 2015), the distance estimate is only marginally affected by a possible intrinsic spread in metallicity within the RRL stars population.
Figure 9 presents the derived histograms for the full and clean samples of RRL (orange solid line), the latter fitted by a Gaussian. The distributions have the maximum at [Fe/H] = −1.76 dex and present a dispersion of 0.32 dex. Martínez-Vázquez et al. (2016a) discussed that the expected dispersion of this method (derived using RRL stars of the globular cluster Reticulum) is ∼0.25 dex. This implies an intrinsic metallicity spread of ∼0.2 dex in the Leo II RRL stars, which, in turn, implies little degree of chemical evolution early in the life of Leo II in the formation epoch of the progenitors of today’s RRL stars.
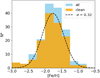 |
Fig. 9. Metallicity distribution of the RRLs constructed inverting the PLI relation, assuming a distance modulus of 21.64 mag. The line shows a Gaussian fit to the clean sample, with mean [Fe/H] = −1.76 dex and σ = 0.32 dex. |
The presence of a metallicity gradient in Leo II has been discussed in the literature (Koch et al. 2007; Ross et al. 2015). A negative slope, with the abundances decreasing towards the outskirts, has been suggested – similarly to other dwarf galaxies (Kirby et al. 2013; Leaman et al. 2013). However, published results for Leo II are not conclusive and show a wide range of values from no slope (Koch et al. 2007) up d[Fe/H]/d(r/rh) = − 22 120.53 dex per rh (with rh = 2.60′ from McConnachie 2012), as found by Ross et al. (2015). These discrepancies could be due to the different methods adopted for obtaining the metallicities, or to biases in the sample of observed stars. Using RRL, we derive a metallicity variation of ΔFe/H = −0.03 per rc (assuming rc = 2.25′ from Muñoz et al. 2018a), which is lower than that obtained with RGB stars and is compatible with nogradient.
5.3. Population gradients
Using the HB type index4, Komiyama et al. (2007) detected a spatial change in the morphology of the HB, such that the HB gets bluer with increasing distance from the centre of Leo II. We repeated the analysis with updated values and obtained virtually identical results, confirming the gradient.
Moreover, we investigated whether the different subpopulations of HB stars present different radial properties based on four samples: blue stars, RRL stars, red HB stars, and red clump stars from the intermediate age population, as shown in Figure 8. The corresponding cumulative distribution of each sample, computed on the basis of the galactocentric distance of individual stars, are reported in Figure 8, which clearly shows the presence of a radial gradient in the HB morphology. In particular, the redder the component, the more centrally concentrated it is. This is in agreement with what is commonly found in nearby dSph galaxies (Harbeck et al. 2001; Monelli et al. 2003; Hidalgo et al. 2011), where an outside-in scenario explains the distribution of younger stars, due to the shrinking of the star forming volume with time.
5.4. The origin of bright variable stars: Anomalous Cepheids and V88
We investigate here the origin and the evolutionary status of bright variable stars, connecting their properties to the SFH of Leo II. We first revise three stars, which appear particularly interesting – namely, the candidates BL Her star V88 and the two ACs, V172 and V176 – and later discuss the full sample of ACs. These three variable stars occupy the CMD region above the RRL stars and are brighter by ∼0.4 to ∼0.6 mag in V band. V88 and V176 have a period close to 0.8 d, while V172 has period close to 0.4 d. V88 and V172 were first reported by Siegel & Majewski (2000), who classified them as an RRab and an AC, respectively, while V176 is a new discovery. It is worth noting that we have visually inspected the image in the areas of the three stars, and all appear to be isolated and unaffected by crowding or blending.
V88 – The location of V88 in the PLI plane (Figure 4) is better represented by the BL Her PLI than the one for RRL or ACs. Indeed, the distance derived using the PL relation for BL Her stars from Das et al. (2021) and Sicignano et al. (2024) is compatible with those derived from the samples of RRL stars and ACs. It is worth noting that the period of V88 is relatively short (P = 0.8141 d), close to the lowest values but still compatible with classification as a BL Her (Bono et al. 2020; Braga et al. 2021; Das et al. 2021, 2024). Additionally, V88 is too bright in the (V, V − I) PW diagram with respect to the RRL stars, but on the other hand it fits the PW relation of the RRL stars well in the (V, B − V) plane.
Figure 11 shows the comparison in the (V, B − I) plane with He-burning stellar models from the BaSTI-IAC library for a metallicity of Z = 0.0006. In particular, the top panel focuses on low-mass models. The solid black line represents the ZAHB for stars with a progenitor mass of 0.8 M⊙, while the dashed-dotted line shows the locus corresponding to the end of the central He-burning phase. The dashed lines indicate the post-ZAHB evolutionary tracks for masses of 0.58, 0.59, and 0.60 M⊙. V88 is close to the end of the exhaustion of the central He-burning. In particular, its position is in good agreement with the evolutionary track for a 0.60 M⊙ star. In this scenario, V88 would be the descendant of a blue HB star, evolving to lower temperatures on a path almost parallel to the ZAHB, but at a higher luminosity. This would support its classification as a BL Her star, in agreement with the conclusion based on the PLI and PW relations.
Lastly, we fitted the light curve of V88 using updated pulsational models (Marconi et al. 2015). In Figure 10 the B-, V-, and I-band light curves of V88 are compared with the predicted light curves for stellar parameters corresponding to an evolved RRL pulsator of Z = 0.0003, Y = 0.245, with a period consistent with the observed one and M = 0.62 M⊙, log L/L⊙ = 1.86 and Teff = 6800 K. We notice that the amplitude and the shape of the observed light curves are satisfactorily reproduced by the selected model in the V and I band, whereas the predicted B band amplitude seems to overestimate the observed one. Indeed, the observed B and V amplitudes and mean magnitudes are closer than what is expected for pulsating stars in the classical IS.
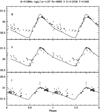 |
Fig. 10. Comparison between the B-, V-, and I-band light curves of V88 (dots) and the predicted light curves (lines) for stellar parameters corresponding to an evolved RRL pulsator of Z = 0.0006, Y = 0.245, with a period consistent with the observed one and M = 0.59 M⊙, log L/L⊙ = 1.87, and Teff = 6650 K. |
V172 and V176 – V172 are in good agreement with the RRc relation for ACs, both in the PLI (Figure 4) and in the PW (Figure 5) plane, supporting its classification as an AC. On the other hand, V176 is always somewhat intermediate between the sequences of ACs and BL Her stars, and indeed the distance derived with the relations for these two classes of variable stars is shifted by 0.2–0.3 mag with respect to the other indicators used here.
Interestingly, their location in the top panel of Figure 11 suggests that V172 and V176 are compatible with evolved stars with masses close to 0.58 M⊙. Nevertheless, note that they are beyond the central He exhaustion, marked by the magenta circle for the three models. This is a fast evolutionary phase, and indeed the models spend less than 10% inside the IS of the total evolutionary time on the HB. This implies a low chance to observe two such stars in the same system, as well as a large and negative period derivative.
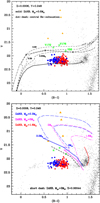 |
Fig. 11. (V, B − I) CMD zoomed on the HB region, showing the location of variable stars compared with selected models from the BasTI-IAC database. The top and bottom panel illustrate the low-mass (< 0.8 M⊙) and high mass models (∼2 M⊙), as labelled. See text for details. |
The bottom panel of the same figure shows a similar comparison for more massive models, assuming the same metallicity. The solid lines indicate the ZAHB for stars with the same progenitor but with different current HB mass, thus assuming different amounts of mass loss during the RGB phase. For example, the blue line connects the points corresponding to masses of 2.2, 2.0, 1.8, and 1.6 M⊙ for models with the same progenitor of 2.2 M⊙. The dashed lines show the evolutionary tracks of the selected masses until the exhaustion of central He-burning. V172 is clearly too faint and/or blue to be explained by these models, while V176 is only marginally fainter that the 2 M⊙ models and is therefore compatible with ACs of such mass. The dashed black line is equivalent to the magenta line, that is a ZAHB for a progenitor mass of 2 M⊙, but for a lower metallicity of Z = 0.00044. This seems to show better agreement with the location of V172, thus supporting the classification of both stars as ACs.
ACs – ACs are particularly intriguing objects because they can form through two different channels. They can be the progeny of single stars with masses between ∼1 and ∼2.2 M⊙. As such, they sample an age range between about 1 and 6 Gyr (Fiorentino et al. 2006). Alternatively, they can result from binary evolution, after passing through a coalescence phase with an evolutionary link with BSs (Renzini et al. 1977). In both cases, a low metallicity (Z ≲ 0.001 dex) is required to push the evolutionary tracks of these stars inside the IS (Monelli & Fiorentino 2022). This was recently confirmed observationally for the first time by Ripepi et al. (2024), who derived spectroscopic metallicity for a sample of field ACs. The bottom panel of Figure 11 reveals that the four brightest ACs are nicely explained as the evolution of stars close to ∼2 M⊙.
The comparison with tracks shown in Figure 7 suggests that the mass at the TO is close to 0.8 and 0.95 M⊙ for the old (> 10 Gyr) and intermediate-age population (∼5–6 Gyr old), respectively. As a working hypothesis, if we assume that the brightest stars in the blue spur are as young as ∼1 Gyr, the mass at the end of that main sequence is close to 1.75 M⊙. The extended SFH of Leo II could therefore trigger the formation of ACs from old binary stars, as commonly found in dSph galaxies dominated by old populations (Mapelli et al. 2006, 2007; Momany et al. 2007; Monelli et al. 2012), but also from the evolution of single intermediate-age or young stars. To test this hypothesis, we used the relation between the frequency of ACs and the luminosity of the host galaxy, originally proposed by Mateo et al. (1995). Fiorentino & Monelli (2012) and Monelli & Fiorentino (2022) disclosed that purely old systems (fast evolvers in the nomenclature of Gallart et al. 2015) follow a distinct relation with respect to galaxies with extended star formation (slow). In particular, they host less ACs for a given global luminosity. This can be explained with the fact that in systems dominated by an old stellar component, the binary systemevolution is the only viable path to produce ACs. Nonetheless, galaxies with extended star formation present a higher fraction of ACs because both channels are simultaneously at play (e.g. Carina, Leo I, and Leo T among others).
The location of Leo II in this plane is shown in Figure 12. The AC frequency in Leo II is clearly in good agreement with the relation corresponding to fast evolvers. This would imply that the single star channel is not contributing significantly to the AC content of Leo II. This is also in agreement with the results by Momany et al. (2007), who investigated a similar correlation for the population of BSs of a sample of MW satellites. Their results indicate that the blue plume along the brighter main sequence of Leo II is composed of BSs only, without contamination from genuine younger stars.
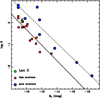 |
Fig. 12. AC frequency as a function of the absolute visual magnitude of the host system for a sample of LG galaxies. The S parameter is defined as the number of AC normalised to the visual luminosity of the host galaxy, in units of 105 L⊙. Purely old galaxies (fast) are shown in red, while dwarfs with extended SFH (slow) are indicated by blue symbols. The location of Leo II is indicated by the green pentagon. |
6. Conclusions
We presented a comprehensive study of the variable star population of the MW dwarf satellites Leo II, based on ground-based BVRI photometry. We discussed the properties of the stellar populations of Leo II, connecting the properties of variable stars (RRL stars and ACs), and the features of the CMD, combining ground-based and space observations. The main conclusions of this work are the following:
– We detect 175 variable stars, 167 RRL stars, six ACs, one peculiar HB variable star, and one variable of uncertain classification, with 28 new discoveries.
– We estimated the distance to Leo II using a variety of different relations available for both RRL stars and ACs. We find consistent results and estimate a distance of (m − M)0 = 21.60 ± 0.03 mag.
– Deep HST photometry strongly supports the existence of extended star formation reaching 5–6 Gyr. This is in agreement with the derived properties of ACs.
– The complexity of SFH is also supported by the complexity of HB morphology. In particular, we detect for the first time substructures in the red HB, compatible with the coexistence of old HB and younger red clump stars.
– We discussed the presence of a plume of blue, relatively bright stars, whose nature could not be firmly established. These could prove the existence of a main sequence of stars as young as ∼1 Gyr, or the existence of bright, massive BSs originating from the intermediate-age binary population.
– The metallicity distribution of RRL stars strongly suggest an intrinsic metallicity dispersion, implying early and fast chemical enrichment. On the other hand, there is marginal evidence of a spatial metallicity gradient in the surveyed area.
Leo II has clearly experienced a complex evolution, and the combined use of the properties of pulsating variable stars and deep CMD was applied to set independent and stronger constraints. Among the distant satellites of the MW, a large variety of SFHs have been found. This includes very old systems as Eridanus II (Gallart et al. 2021; Simon et al. 2021), as well as objects with extended star formation such as Leo T (Clementini et al. 2012; Weisz et al. 2012), and various other objects with different truncation ages, such as Leo I (Ruiz-Lara et al. 2021) and Fornax (Rusakov et al. 2021). A more detailed, quantitative derivation of the SFH of this galaxy will help answer the questions that remain unsolved.
Data availability
Full Tables 2 and 3 are available at the CDS via https://cdsarc.cds.unistra.fr/viz-bin/cat/J/A+A/700/A201
The RRL V173 was discovered by Bellazzini et al. (2005).
τ = (B − R)/(B + V + R), where B and R are blue and red HB stars and V is the number of RRL stars.
Acknowledgments
M.Mo. acknowledges support from Spanish Ministry of Science, Innovation and Universities (MICIU) through the Spanish State Research Agency under the grants “RR Lyrae stars, a lighthouse to distant galaxies and early galaxy evolution” and the European Regional Development Fun (ERDF) with reference PID2021-127042OB-I00 and from the Severo Ochoa Programe 2020-2023 (CEX2019-000920-S). M.Mo and CG acknowledge support from the Agencia Estatal de Investigación del Ministerio de Ciencia e Innovación (AEI-MCINN) under grants “At the forefront of Galactic Archaeology: evolution of the luminous and dark matter components of the MW and LG dwarf galaxies in the Gaia era” with references PID2020-118778GB-I00/10.13039/501100011033 and PID2023-150319NB-C21/10.13039/501100011033. M.Mo and G.F. acknowledge the INAF projects “Participation in LSST – Large Synoptic Survey Telescope” (LSST inkind contribution ITA-INA-S22, PI: G. Fiorentino), OB.FU. 1.05.03.06 and “MINI-GRANTS (2023) DI RSN2” (PI: G. Fiorentino), OB.FU. 1.05.23.04.02. A.M.P. and S.C. acknowledge funds by the European Union - NextGenerationEU" RRF M4C2 1.1 n: 2022HY2NSX. “CHRONOS: adjusting the clock(s) to unveil the CHRONO-chemo-dynamical Structure of the Galaxy” (PI: S. Cassisi). SC acknowledges also the support of a fellowship from La Caixa Foundation (ID 100010434) with fellowship code LCF/BQ/PI23/11970031 (P.I.: A. Escorza) and from the Fundación Occident and the Instituto de Astrofísica de Canarias under the Visiting Researcher Programme 2022-2025 agreed between both institutions. C.E.M.-V. is supported by the international Gemini Observatory, a programme of NSF NOIRLab, which is managed by the Association of Universities for Research in Astronomy (AURA) under a cooperative agreement with the U.S. National Science Foundation, on behalf of the Gemini partnership of Argentina, Brazil, Canada, Chile, the Republic of Korea, and the United States of America. This research was supported by the International Space Science Institute (ISSI) in Bern/Beijing through ISSI/ISSI-BJ International Team project ID #24-603 – “EXPANDING Universe” (EXploiting Precision AstroNomical Distance INdicators in the Gaia Universe). M.Ma. was supported by the grants Project PRIN MUR 2022 (code 2022ARWP9C) "Early Formation and Evolution of Bulge and HalO (EFEBHO)", PI: Marconi, M., funded by European Union – Next Generation EU, and the Large grant INAF 2023 MOVIE (PI: M. Marconi). This research was supported by the Munich Institute for Astro-, Particle and BioPhysics (MIAPbP), which is funded by the Deutsche Forschungsgemeinschaft (DFG, German Research Foundation) under Germany’s Excellence Strategy - EXC-2094 - 390783311. This article is partly based on observations made with the IAC80 telescope operated on the island of Tenerife by the Instituto de Astrofísica de Canarias in the Spanish Observatorio del Teide. The Isaac Newton Telescope and its service programme are operated on the island of La Palma by the Isaac Newton Group of Telescopes in the Spanish Observatorio del Roque de los Muchachos of the Instituto de Astrofísica de Canarias. Based on observations made at NSF Cerro Tololo Inter-American Observatory, NSF NOIRLab, which is managed by the Association of Universities for Research in Astronomy (AURA) under a cooperative agreement with the U.S. National Science Foundation. Based on observations collected at the European Organisation for Astronomical Research in the Southern Hemisphere under ESO programme 63.H-0365(A). Based in part on observations at NSF Kitt Peak National Observatory, NSF NOIRLab (NOIRLab Prop. ID 1605, 2291, 2014A-0555), which is managed by the Association of Universities for Research in Astronomy (AURA) under a cooperative agreement with the U.S. National Science Foundation. The authors are honored to be permitted to conduct astronomical research on I’oligam Du’ag (Kitt Peak), a mountain with particular significance to the Tohono O’odham. This research is based in part on data collected at the Subaru Telescope, which is operated by the National Astronomical Observatory of Japan. We are honored and grateful for the opportunity of observing the Universe from Maunakea, which has the cultural, historical, and natural significance in Hawaii. The authors wish to recognise and acknowledge the very significant cultural role and reverence that the summit of Maunakea has always had within the Native Hawaiian community. We are most fortunate to have the opportunity to conduct observations from this mountain. Partly based on observations made with the Italian Telescopio Nazionale Galileo (TNG) operated on the island of La Palma by the Fundación Galileo Galilei of the INAF (Istituto Nazionale di Astrofisica) at the Spanish Observatorio del Roque de los Muchachos.
References
- Aaronson, M., Olszewski, E. W., & Hodge, P. W. 1983, ApJ, 267, 271 [Google Scholar]
- Alcock, C., Allsman, R. A., Alves, D. R., et al. 2000, AJ, 119, 2194 [Google Scholar]
- Battaglia, G., Taibi, S., Thomas, G. F., & Fritz, T. K. 2022, A&A, 657, A54 [NASA ADS] [CrossRef] [EDP Sciences] [Google Scholar]
- Bellazzini, M., Gennari, N., & Ferraro, F. R. 2005, MNRAS, 360, 185 [NASA ADS] [CrossRef] [Google Scholar]
- Bennet, P., Patel, E., Sohn, S. T., et al. 2024, ApJ, 971, 98 [Google Scholar]
- Bernard, E. J., Monelli, M., Gallart, C., et al. 2009, ApJ, 699, 1742 [NASA ADS] [CrossRef] [Google Scholar]
- Bhardwaj, A., Ripepi, V., Testa, V., et al. 2024, A&A, 683, A234 [NASA ADS] [CrossRef] [EDP Sciences] [Google Scholar]
- Bono, G. 2003, in Stellar Candles for the Extragalactic Distance Scale, eds. D. Alloin, & W. Gieren (Berlin: Springer Verlag), Lecture Notes in Physics, 635, 85 [Google Scholar]
- Bono, G., Braga, V. F., Fiorentino, G., et al. 2020, A&A, 644, A96 [NASA ADS] [CrossRef] [EDP Sciences] [Google Scholar]
- Bono, G., Braga, V. F., & Pietrinferni, A. 2024, A&ARv, 32, 4 [Google Scholar]
- Bosler, T. L., Smecker-Hane, T. A., & Stetson, P. B. 2007, MNRAS, 378, 318 [NASA ADS] [CrossRef] [Google Scholar]
- Braga, V. F., Stetson, P. B., Bono, G., et al. 2016, AJ, 152, 170 [Google Scholar]
- Braga, V. F., Crestani, J., Fabrizio, M., et al. 2021, ApJ, 919, 85 [NASA ADS] [CrossRef] [Google Scholar]
- Braga, V. F., Fiorentino, G., Bono, G., et al. 2022, MNRAS, 517, 5368 [NASA ADS] [CrossRef] [Google Scholar]
- Carretta, E., Bragaglia, A., Gratton, R., D’Orazi, V., & Lucatello, S. 2009, A&A, 508, 695 [NASA ADS] [CrossRef] [EDP Sciences] [Google Scholar]
- Clementini, G., Cignoni, M., Contreras Ramos, R., et al. 2012, ApJ, 756, 108 [NASA ADS] [CrossRef] [Google Scholar]
- Coleman, M. G., Jordi, K., Rix, H.-W., Grebel, E. K., & Koch, A. 2007, AJ, 134, 1938 [Google Scholar]
- Das, S., Kanbur, S. M., Smolec, R., et al. 2021, MNRAS, 501, 875 [Google Scholar]
- Das, S., Molnár, L., Kanbur, S. M., et al. 2024, A&A, 684, A170 [NASA ADS] [CrossRef] [EDP Sciences] [Google Scholar]
- De Somma, G., Marconi, M., Molinaro, R., et al. 2020, ApJS, 247, 30 [Google Scholar]
- del Pino, A., Hidalgo, S. L., Aparicio, A., et al. 2013, MNRAS, 433, 1505 [Google Scholar]
- Demers, S., & Harris, W. E. 1983, AJ, 88, 329 [Google Scholar]
- D’Onghia, E., Besla, G., Cox, T. J., & Hernquist, L. 2009, Nature, 460, 605 [CrossRef] [Google Scholar]
- Fabrizio, M., Bono, G., Braga, V. F., et al. 2019, ApJ, 882, 169 [Google Scholar]
- Fiorentino, G., & Monelli, M. 2012, A&A, 540, A102 [NASA ADS] [CrossRef] [EDP Sciences] [Google Scholar]
- Fiorentino, G., Limongi, M., Caputo, F., & Marconi, M. 2006, A&A, 460, 155 [NASA ADS] [CrossRef] [EDP Sciences] [Google Scholar]
- Fritz, T. K., Battaglia, G., Pawlowski, M. S., et al. 2018, A&A, 619, A103 [NASA ADS] [CrossRef] [EDP Sciences] [Google Scholar]
- Gallart, C., Monelli, M., Mayer, L., et al. 2015, ApJ, 811, L18 [NASA ADS] [CrossRef] [Google Scholar]
- Gallart, C., Monelli, M., Ruiz-Lara, T., et al. 2021, ApJ, 909, 192 [NASA ADS] [CrossRef] [Google Scholar]
- Garofalo, A., Delgado, H. E., Sarro, L. M., et al. 2022, MNRAS, 513, 788 [NASA ADS] [CrossRef] [Google Scholar]
- Groenewegen, M. A. T., & Jurkovic, M. I. 2017, A&A, 604, A29 [NASA ADS] [CrossRef] [EDP Sciences] [Google Scholar]
- Gullieuszik, M., Held, E. V., Rizzi, L., et al. 2008, MNRAS, 388, 1185 [CrossRef] [Google Scholar]
- Harbeck, D., Grebel, E. K., Holtzman, J., et al. 2001, AJ, 122, 3092 [NASA ADS] [CrossRef] [Google Scholar]
- Harrington, R. G., & Wilson, A. G. 1950, PASP, 62, 118 [NASA ADS] [CrossRef] [Google Scholar]
- Hidalgo, S. L., Aparicio, A., Skillman, E., et al. 2011, ApJ, 730, 14 [Google Scholar]
- Hidalgo, S. L., Pietrinferni, A., Cassisi, S., et al. 2018, ApJ, 856, 125 [Google Scholar]
- Hodge, P. W. 1962, AJ, 67, 125 [NASA ADS] [CrossRef] [Google Scholar]
- Irwin, M., & Hatzidimitriou, D. 1995, MNRAS, 277, 1354 [NASA ADS] [CrossRef] [Google Scholar]
- Ivezić, Ž., Connelly, A. J., VanderPlas, J. T., & Gray, A. 2014, Statistics, Data Mining and Machine Learning in Astronomy [Google Scholar]
- Júlio, M. P., Pawlowski, M. S., Tony Sohn, S., et al. 2024, A&A, 687, A212 [NASA ADS] [CrossRef] [EDP Sciences] [Google Scholar]
- Jurcsik, J., & Kovacs, G. 1996, A&A, 312, 111 [Google Scholar]
- Kirby, E. N., Guhathakurta, P., Simon, J. D., et al. 2010, ApJS, 191, 352 [NASA ADS] [CrossRef] [Google Scholar]
- Kirby, E. N., Lanfranchi, G. A., Simon, J. D., Cohen, J. G., & Guhathakurta, P. 2011, ApJ, 727, 78 [Google Scholar]
- Kirby, E. N., Boylan-Kolchin, M., Cohen, J. G., et al. 2013, ApJ, 770, 16 [NASA ADS] [CrossRef] [Google Scholar]
- Koch, A., Grebel, E. K., Kleyna, J. T., et al. 2007, AJ, 133, 270 [Google Scholar]
- Komiyama, Y., Doi, M., Furusawa, H., et al. 2007, AJ, 134, 835 [NASA ADS] [CrossRef] [Google Scholar]
- Landolt, A. U. 1973, AJ, 78, 959 [NASA ADS] [CrossRef] [Google Scholar]
- Landolt, A. U. 2009, AJ, 137, 4186 [Google Scholar]
- Layden, A. C., Ritter, L. A., Welch, D. L., & Webb, T. M. A. 1999, AJ, 117, 1313 [NASA ADS] [CrossRef] [Google Scholar]
- Leaman, R., Venn, K. A., Brooks, A. M., et al. 2013, ApJ, 767, 131 [NASA ADS] [CrossRef] [Google Scholar]
- Lépine, S., Koch, A., Rich, R. M., & Kuijken, K. 2011, ApJ, 741, 100 [CrossRef] [Google Scholar]
- Li, H., Hammer, F., Babusiaux, C., et al. 2021, ApJ, 916, 8 [CrossRef] [Google Scholar]
- Lianou, S., Grebel, E. K., & Koch, A. 2011, A&A, 531, A152 [NASA ADS] [CrossRef] [EDP Sciences] [Google Scholar]
- Lora, V., Grebel, E. K., Schmeja, S., & Koch, A. 2019, ApJ, 878, 152 [NASA ADS] [CrossRef] [Google Scholar]
- Mapelli, M., Sigurdsson, S., Ferraro, F. R., et al. 2006, MNRAS, 373, 361 [Google Scholar]
- Mapelli, M., Ripamonti, E., Tolstoy, E., et al. 2007, MNRAS, 380, 1127 [NASA ADS] [CrossRef] [Google Scholar]
- Marconi, M., Coppola, G., Bono, G., et al. 2015, ApJ, 808, 50 [Google Scholar]
- Martínez Vázquez, C. E. 2016, PhD thesis, Universidad de La Laguna, Spain [Google Scholar]
- Martínez-Vázquez, C. E., Monelli, M., Bono, G., et al. 2015, MNRAS, 454, 1509 [Google Scholar]
- Martínez-Vázquez, C. E., Monelli, M., Gallart, C., et al. 2016a, MNRAS, 461, L41 [Google Scholar]
- Martínez-Vázquez, C. E., Stetson, P. B., Monelli, M., et al. 2016b, MNRAS, 462, 4349 [CrossRef] [Google Scholar]
- Martínez-Vázquez, C. E., Monelli, M., Bernard, E. J., et al. 2017, ApJ, 850, 137 [CrossRef] [Google Scholar]
- Martínez-Vázquez, C. E., Monelli, M., Cassisi, S., et al. 2021, MNRAS, 508, 1064 [CrossRef] [Google Scholar]
- Mateo, M., Fischer, P., & Krzeminski, W. 1995, AJ, 110, 2166 [NASA ADS] [CrossRef] [Google Scholar]
- Mayer, L. 2010, Adv. Astron., 2010 [Google Scholar]
- McConnachie, A. W. 2012, AJ, 144, 4 [Google Scholar]
- McConnachie, A. W., & Venn, K. A. 2020a, AJ, 160, 124 [Google Scholar]
- McConnachie, A. W., & Venn, K. A. 2020b, Res. Notes. Am. Astron. Soc., 4, 229 [Google Scholar]
- Mighell, K. J. 1997, AJ, 114, 1458 [NASA ADS] [CrossRef] [Google Scholar]
- Momany, Y., Held, E. V., Saviane, I., et al. 2007, A&A, 468, 973 [NASA ADS] [CrossRef] [EDP Sciences] [Google Scholar]
- Monelli, M., & Fiorentino, G. 2022, Universe, 8, 191 [NASA ADS] [CrossRef] [Google Scholar]
- Monelli, M., Pulone, L., Corsi, C. E., et al. 2003, AJ, 126, 218 [NASA ADS] [CrossRef] [Google Scholar]
- Monelli, M., Hidalgo, S. L., Stetson, P. B., et al. 2010, ApJ, 720, 1225 [CrossRef] [Google Scholar]
- Monelli, M., Cassisi, S., Mapelli, M., et al. 2012, ApJ, 744, 157 [Google Scholar]
- Monelli, M., Walker, A. R., Martínez-Vázquez, C. E., et al. 2018, MNRAS, 479, 4279 [Google Scholar]
- Muñoz, R. R., Côté, P., Santana, F. A., et al. 2018a, ApJ, 860, 65 [CrossRef] [Google Scholar]
- Muñoz, R. R., Côté, P., Santana, F. A., et al. 2018b, ApJ, 860, 66 [CrossRef] [Google Scholar]
- Pace, A. B., Erkal, D., & Li, T. S. 2022, ApJ, 940, 136 [NASA ADS] [CrossRef] [Google Scholar]
- Pawlowski, M. S., Kroupa, P., & Jerjen, H. 2013, MNRAS, 435, 1928 [NASA ADS] [CrossRef] [Google Scholar]
- Piatek, S., Pryor, C., & Olszewski, E. W. 2016, AJ, 152, 166 [NASA ADS] [CrossRef] [Google Scholar]
- Pietrinferni, A., Cassisi, S., Salaris, M., & Castelli, F. 2004, ApJ, 612, 168 [Google Scholar]
- Pietrzyński, G., Graczyk, D., Gallenne, A., et al. 2019, Nature, 567, 200 [Google Scholar]
- Pritzl, B. J., Smith, H. A., Catelan, M., & Sweigart, A. V. 2002, AJ, 124, 949 [Google Scholar]
- Renzini, A., Mengel, J. G., & Sweigart, A. V. 1977, A&A, 56, 369 [NASA ADS] [Google Scholar]
- Ripepi, V., Catanzaro, G., Trentin, E., et al. 2024, A&A, 682, A1 [NASA ADS] [CrossRef] [EDP Sciences] [Google Scholar]
- Ripepi, V., Marconi, M., Moretti, M. I., et al. 2014a, MNRAS, 437, 2307 [Google Scholar]
- Ripepi, V., Molinaro, R., Marconi, M., et al. 2014b, MNRAS, 437, 906 [Google Scholar]
- Ross, T. L., Holtzman, J., Saha, A., & Anthony-Twarog, B. J. 2015, AJ, 149, 198 [Google Scholar]
- Ruiz-Lara, T., Gallart, C., Monelli, M., et al. 2021, MNRAS, 501, 3962 [NASA ADS] [CrossRef] [Google Scholar]
- Rusakov, V., Monelli, M., Gallart, C., et al. 2021, MNRAS, 502, 642 [NASA ADS] [CrossRef] [Google Scholar]
- Schlafly, E. F., & Finkbeiner, D. P. 2011, ApJ, 737, 103 [Google Scholar]
- Shetrone, M. D., Siegel, M. H., Cook, D. O., & Bosler, T. 2009, AJ, 137, 62 [Google Scholar]
- Sicignano, T., Ripepi, V., Marconi, M., et al. 2024, A&A, 685, A41 [NASA ADS] [CrossRef] [EDP Sciences] [Google Scholar]
- Siegel, M. H., & Majewski, S. R. 2000, AJ, 120, 284 [Google Scholar]
- Simon, J. D., Brown, T. M., Drlica-Wagner, A., et al. 2021, ApJ, 908, 18 [CrossRef] [Google Scholar]
- Skillman, E. D., & Bender, R. 1995, in Revista Mexicana de Astronomia y Astrofisica Conference Series, eds. M. Pena, & S. Kurtz, 3, 25 [Google Scholar]
- Sohn, S. T., Patel, E., Besla, G., et al. 2017, ApJ, 849, 93 [Google Scholar]
- Soszyński, I., Udalski, A., Szymański, M. K., et al. 2008, Acta Astron., 58, 293 [NASA ADS] [Google Scholar]
- Soszyński, I., Udalski, A., Szymański, M. K., et al. 2015, Acta Astron., 65, 233 [NASA ADS] [Google Scholar]
- Spencer, M. E., Mateo, M., Walker, M. G., & Olszewski, E. W. 2017, ApJ, 836, 202 [NASA ADS] [CrossRef] [Google Scholar]
- Stetson, P. B. 1987, PASP, 99, 191 [Google Scholar]
- Stetson, P. B. 1994, PASP, 106, 250 [Google Scholar]
- Stetson, P. B. 1996, PASP, 108, 851 [NASA ADS] [CrossRef] [Google Scholar]
- Stetson, P. B. 2000, PASP, 112, 925 [Google Scholar]
- Stetson, P. B., Fiorentino, G., Bono, G., et al. 2014, PASP, 126, 616 [Google Scholar]
- Suntzeff, N. B., Aaronson, M., Olszewski, E. W., & Cook, K. H. 1986, AJ, 91, 1091 [Google Scholar]
- Swope, H. H. 1967, PASP, 79, 439 [Google Scholar]
- Swope, H. H. 1968, ApJS, 73, 204 [Google Scholar]
- Tolstoy, E., Hill, V., & Tosi, M. 2009, ARA&A, 47, 371 [Google Scholar]
- Torrealba, G., Koposov, S. E., Belokurov, V., & Irwin, M. 2016, MNRAS, 459, 2370 [NASA ADS] [CrossRef] [Google Scholar]
- Vivas, A. K., Walker, A. R., Martínez-Vázquez, C. E., et al. 2020, MNRAS, 492, 1061 [NASA ADS] [CrossRef] [Google Scholar]
- Walker, A. R. 1989, AJ, 98, 2086 [Google Scholar]
- Weisz, D. R., Zucker, D. B., Dolphin, A. E., et al. 2012, ApJ, 748, 88 [CrossRef] [Google Scholar]
- Welch, D. L., & Stetson, P. B. 1993, AJ, 105, 1813 [NASA ADS] [CrossRef] [Google Scholar]
Appendix A: Light curves: RR Lyrae stars
BVI-band light curves of the RRL stars identified in Leo II. The B and I points are shifted vertically to avoid overlap by +0.75 and 0.75 mag, respectively. The yellow and white background identify stars with good and problematic light curves.
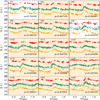 |
Fig. A.1. B− (bottom), V− (centre), I− (top) band light curves for RRL stars in Leo II |
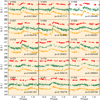 |
Fig. A.10. Fig. A.1 continued |
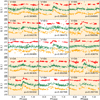 |
Fig. A.11. Fig. A.1 continued |
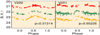 |
Fig. A.12. Fig. A.1 continued |
Appendix B: Light curves: Anomalous Cepheids
BVI-band light curves of the ACs identified in Leo II.
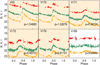 |
Fig. B.1. B−, V−, I− band light curves for AC stars in Leo II |
Appendix C: Light curves: other stars
BVI− band light curves of the V88 star, the BL Her candidate star in Leo II, and the unclassified V190 star.
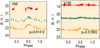 |
Fig. C.1. B−, V−, I− band light curves for V88 (left) and V190 (right) |
All Tables
All Figures
|
Fig. 1. Spatial distribution of 4742 Leo II stars selected according to their position, sharpness, and photometric error (0 < rell < 0.19 deg, |sharp|< 0.1 and sqrt(σB2 + σV2 < 0.07)). The red and blue circles show the locations of RRab and RRc type stars, respectively, with empty symbols indicating objects with poor light curves. The ACs are indicated as orange triangles, while V190, with uncertain classification, is highlighted with a purple diamond. V88, the likely BL Her variable star, is indicated with a dark green star. The black squares around the other symbols indicate newly discovered or re-classified variable stars. The solid and dashed ellipses indicate respectively the position of the half-light (2.46′) and tidal (9.82′) radii from Muñoz et al. (2018b), assuming the centre, position angle, and ellipticity derived in Sect. 2.1. The two green squares show the location of the two HST/WFC3 fields. |
| In the text | |
|
Fig. 2. From left to right: (B, B − I), (V, B − V), and (I, B − I) CMDs of Leo II with the analysed variable stars superimposed. The symbols are the same as in Figure 1. |
| In the text | |
|
Fig. 3. Period-amplitude (Bailey) diagram for all the detected variable stars. |
| In the text | |
|
Fig. 4. De-reddened I0 magnitude vs. Log P for all the classified variables, compared to the PL relations for the ACs (dashed lines, from Ripepi et al. 2014a), the Type II Cepheids (dotted line, from Sicignano et al. 2024), and the RRLs (solid line, from Marconi et al. 2015). |
| In the text | |
|
Fig. 5. PW plane for the RRL stars along with V88. The left column shows the RRab and RRc separately, while the RRc have been fundamentalised in the right column. The top and bottom panels indicate the (I, V − I) and (V, B − V) filter combinations. |
| In the text | |
|
Fig. 6. (V, V − I) PW relation for the ACs, fitted by the PW relation provided by Ripepi et al. (2014a) for RRab and RRc AC pulsators. The shaded region accounts for the standard deviation of Leo II distance modulus (computed as in the text), the error on the adopted PW relation, and the assumed LMC distance. The position of V88 (star symbol) is also reported. |
| In the text | |
|
Fig. 7. (V,V − I) CMD of Leo II from both ground-based (left) and space observations (HST/WFC3, right). Selected isochrones for the BaSTI-IAC database are superimposed to the right panel. |
| In the text | |
|
Fig. 8. Top: (V, B − I) CMD illustrating the selection of blue HB (blue points), red HB (pink), and red clump stars (red). The RRLs are plotted as green circles. The upper portion of the top panel shows the colour histogram of the pink, red, and full sample (in black). Bottom: Cumulative distribution vs the galactocentric radius of the four HB subsamples. This indicates that the redder the component, the higher the central concentration. |
| In the text | |
|
Fig. 9. Metallicity distribution of the RRLs constructed inverting the PLI relation, assuming a distance modulus of 21.64 mag. The line shows a Gaussian fit to the clean sample, with mean [Fe/H] = −1.76 dex and σ = 0.32 dex. |
| In the text | |
|
Fig. 10. Comparison between the B-, V-, and I-band light curves of V88 (dots) and the predicted light curves (lines) for stellar parameters corresponding to an evolved RRL pulsator of Z = 0.0006, Y = 0.245, with a period consistent with the observed one and M = 0.59 M⊙, log L/L⊙ = 1.87, and Teff = 6650 K. |
| In the text | |
|
Fig. 11. (V, B − I) CMD zoomed on the HB region, showing the location of variable stars compared with selected models from the BasTI-IAC database. The top and bottom panel illustrate the low-mass (< 0.8 M⊙) and high mass models (∼2 M⊙), as labelled. See text for details. |
| In the text | |
|
Fig. 12. AC frequency as a function of the absolute visual magnitude of the host system for a sample of LG galaxies. The S parameter is defined as the number of AC normalised to the visual luminosity of the host galaxy, in units of 105 L⊙. Purely old galaxies (fast) are shown in red, while dwarfs with extended SFH (slow) are indicated by blue symbols. The location of Leo II is indicated by the green pentagon. |
| In the text | |
|
Fig. A.1. B− (bottom), V− (centre), I− (top) band light curves for RRL stars in Leo II |
| In the text | |
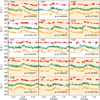 |
Fig. A.2. Fig. A.1 continued |
| In the text | |
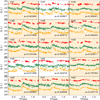 |
Fig. A.3. Fig. A.1 continued |
| In the text | |
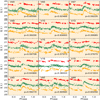 |
Fig. A.4. Fig. A.1 continued |
| In the text | |
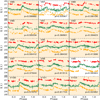 |
Fig. A.5. Fig. A.1 continued |
| In the text | |
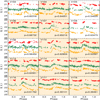 |
Fig. A.6. Fig. A.1 continued |
| In the text | |
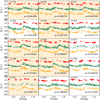 |
Fig. A.7. Fig. A.1 continued |
| In the text | |
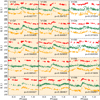 |
Fig. A.8. Fig. A.1 continued |
| In the text | |
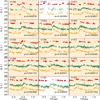 |
Fig. A.9. Fig. A.1 continued |
| In the text | |
|
Fig. A.10. Fig. A.1 continued |
| In the text | |
|
Fig. A.11. Fig. A.1 continued |
| In the text | |
|
Fig. A.12. Fig. A.1 continued |
| In the text | |
|
Fig. B.1. B−, V−, I− band light curves for AC stars in Leo II |
| In the text | |
|
Fig. C.1. B−, V−, I− band light curves for V88 (left) and V190 (right) |
| In the text | |
Current usage metrics show cumulative count of Article Views (full-text article views including HTML views, PDF and ePub downloads, according to the available data) and Abstracts Views on Vision4Press platform.
Data correspond to usage on the plateform after 2015. The current usage metrics is available 48-96 hours after online publication and is updated daily on week days.
Initial download of the metrics may take a while.