Fig. 1.
Download original image
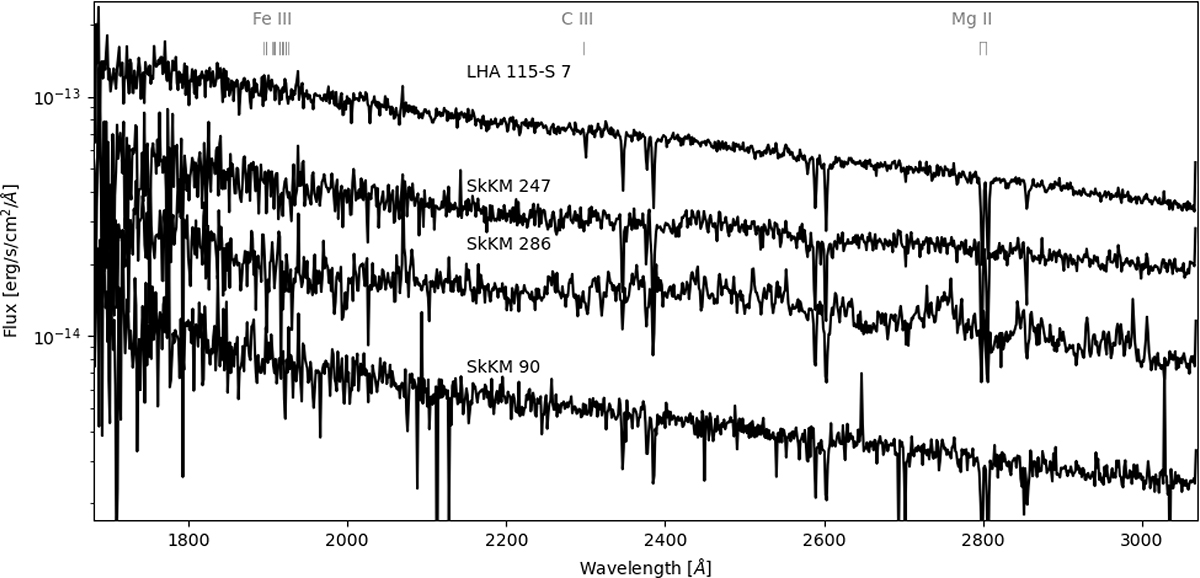
Montage of the observed HST/STIS UV spectra. Each spectrum has a S/N per resolution element of at least 30 at ∼2400 Å, ranging to ∼60 for LHA 115-S 7. The flux distribution is not normalised, to enable a better visualisation of the hot star continuum. Line identifications are marked in grey; however, we note that the only features detectable in the spectra are of interstellar origin and not suitable for stellar parameter determination. No normalisation factor is applied to any of the spectra displayed here. All 16 spectra are shown individually in Appendix A.
Current usage metrics show cumulative count of Article Views (full-text article views including HTML views, PDF and ePub downloads, according to the available data) and Abstracts Views on Vision4Press platform.
Data correspond to usage on the plateform after 2015. The current usage metrics is available 48-96 hours after online publication and is updated daily on week days.
Initial download of the metrics may take a while.