Fig. A.1.
Download original image
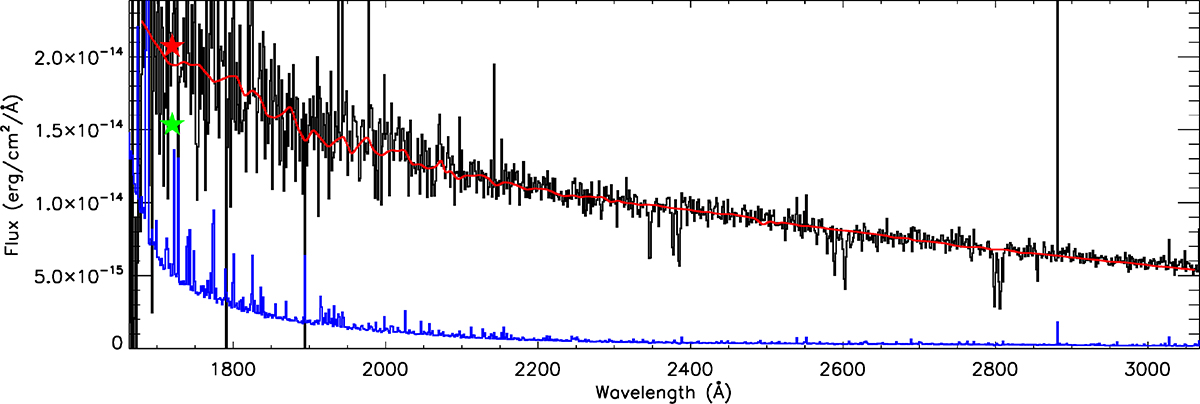
Example of the result of the χ-squared fitting procedure for SkKM 113. The black line shows the observed data, and the red line the best-fitting model with an effective temperature of 25kK and logg = 4.0. The red star marks the synthetic photometry in the UVIT F172M band, which was computed directly from the HST spectrum. The green star marks the UVIT F172M magnitude from Thilker et al. (in prep.). The difference in magnitude between the two is ∼0.3mag.
Current usage metrics show cumulative count of Article Views (full-text article views including HTML views, PDF and ePub downloads, according to the available data) and Abstracts Views on Vision4Press platform.
Data correspond to usage on the plateform after 2015. The current usage metrics is available 48-96 hours after online publication and is updated daily on week days.
Initial download of the metrics may take a while.