Fig. 11.
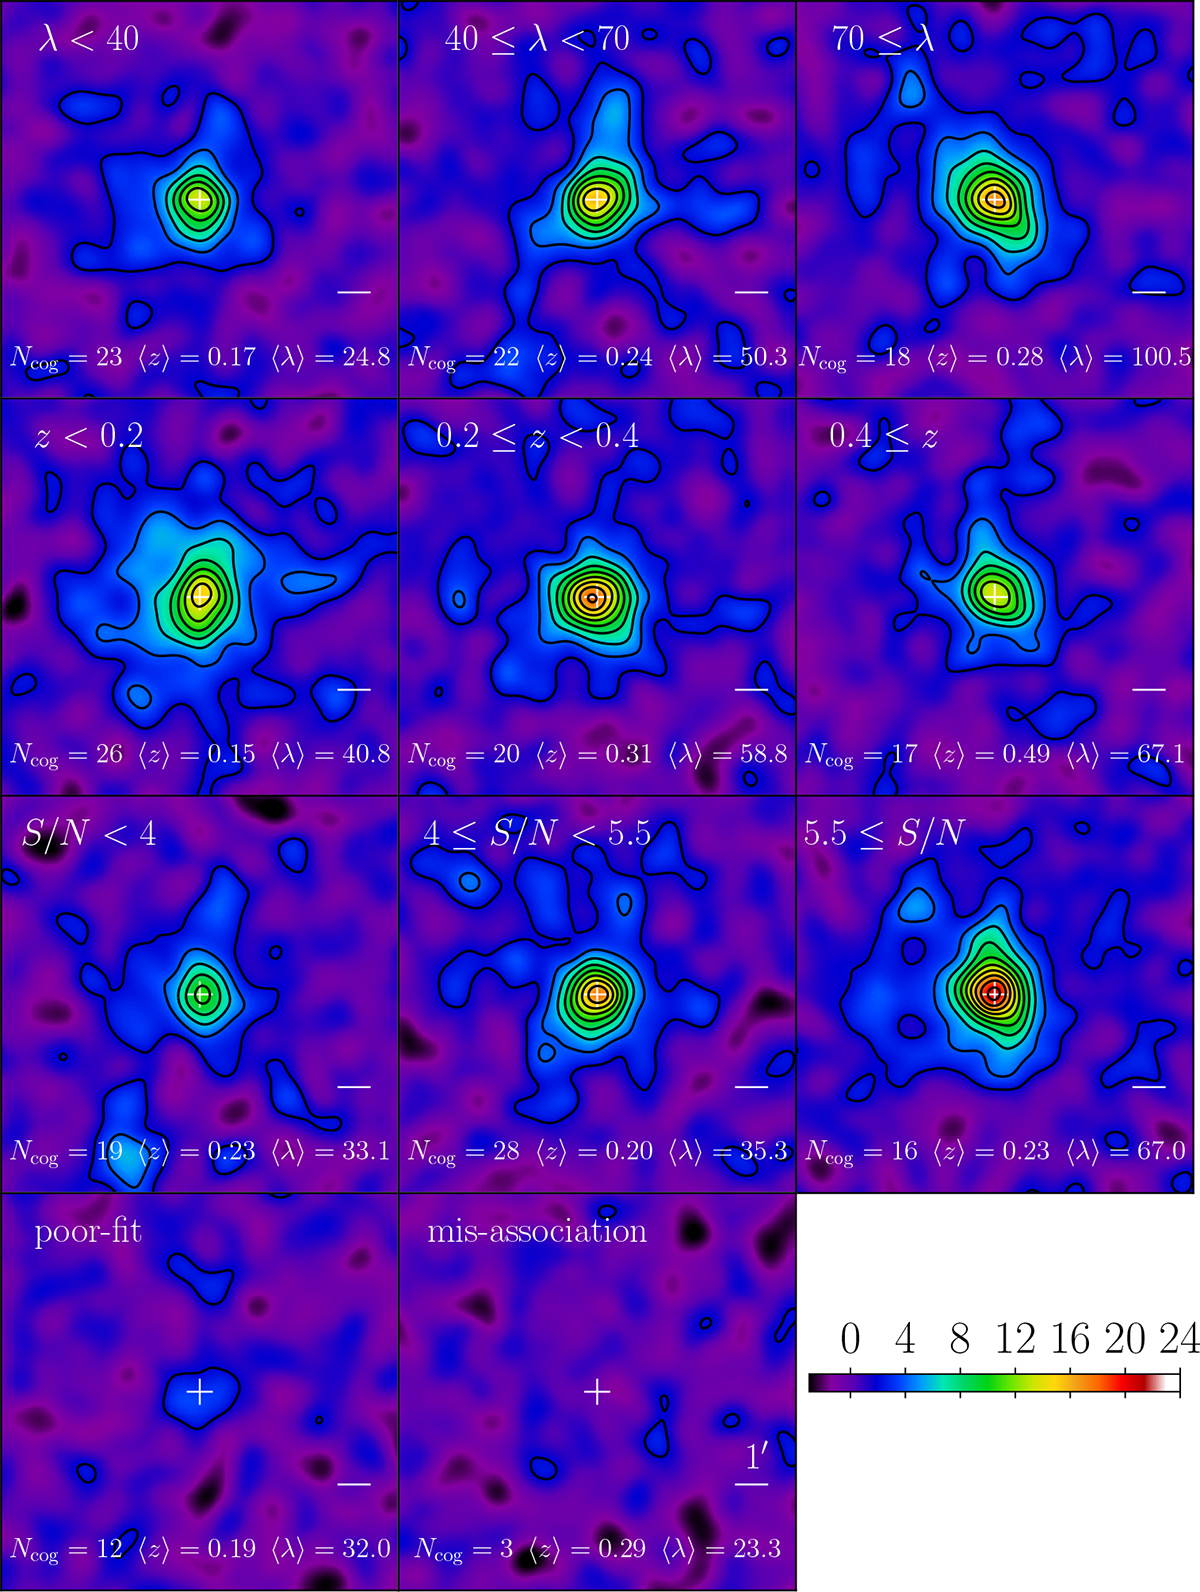
Download original image
S/N of stacked mass maps for the subsamples (12′×12′). The black contours represent the reconstructed WL mass map spaced in units of 2σ bootstrapping error starting from 2σ. The first, second, and third rows from the top show the maps for the subsamples divided by richness, redshift, and the S/N in the tangential shear, respectively. These samples exclude the poor-fit and misassociation clusters. The left and right panels in the bottom row show the mass maps for the poor-fit and misassociation clusters, respectively. The selection criteria are described in the upper part of each panel. The white crosses denote the eRASS1 centroids. The white horizontal line corresponds to the smoothing FWHM of 1′. The number of clusters, the average redshift, and the average richness are described in the lower part of each panel.
Current usage metrics show cumulative count of Article Views (full-text article views including HTML views, PDF and ePub downloads, according to the available data) and Abstracts Views on Vision4Press platform.
Data correspond to usage on the plateform after 2015. The current usage metrics is available 48-96 hours after online publication and is updated daily on week days.
Initial download of the metrics may take a while.