Fig. 12.
Download original image
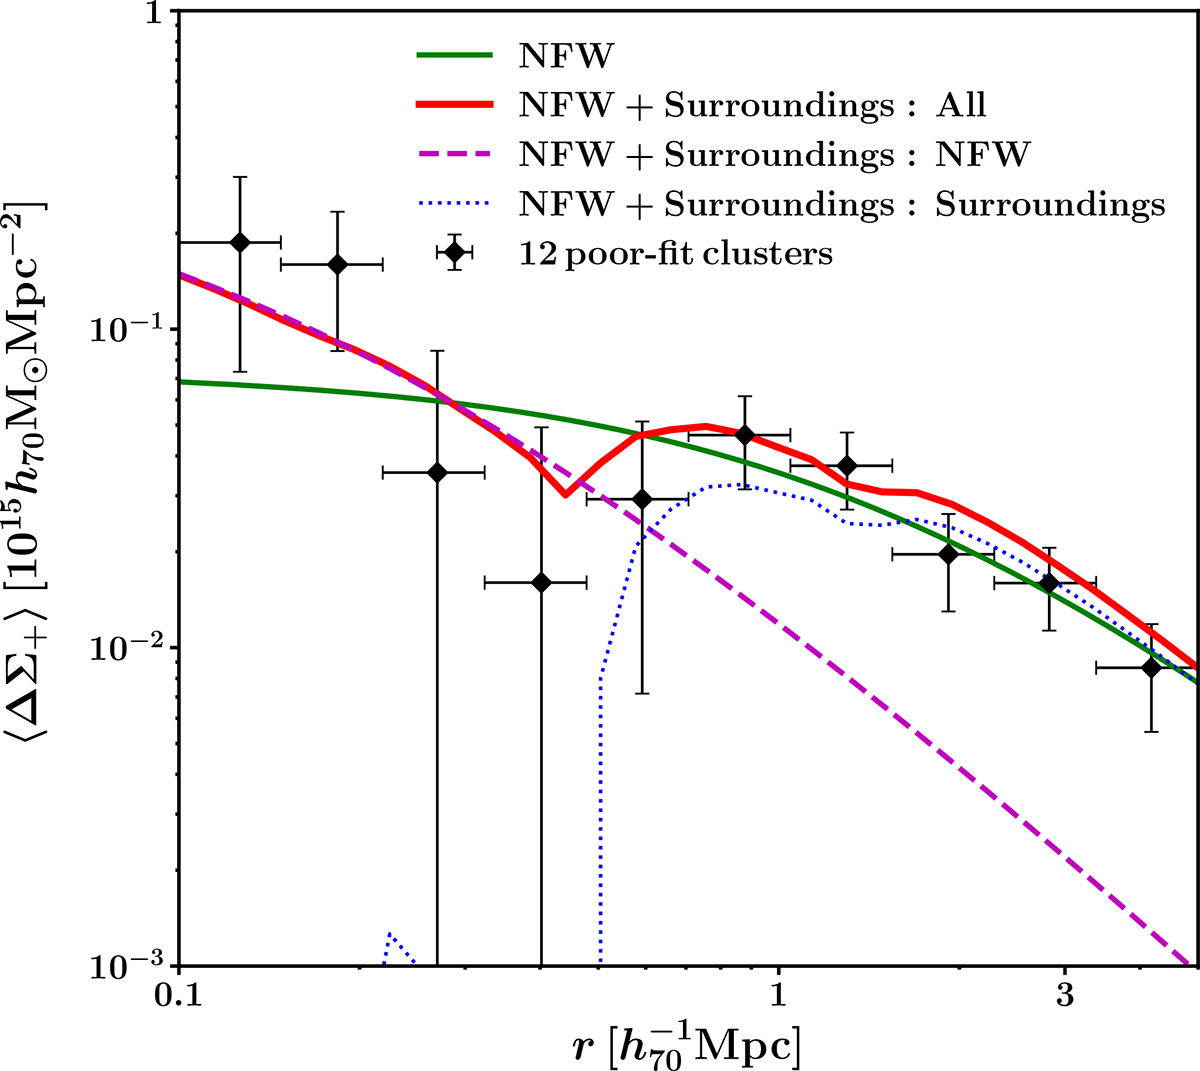
Stacked tangential shear profile for the 12 poor-fit clusters (same as Fig. 6). The green solid line denotes the best-fit model for a single NFW model, but showing ![]() . The red solid denotes the total lensing profile composed of the main NFW model and the surrounding halos. The magenta dashed and blue dotted lines are the tangential shear profiles of the NFW component and the surrounding halos, respectively.
. The red solid denotes the total lensing profile composed of the main NFW model and the surrounding halos. The magenta dashed and blue dotted lines are the tangential shear profiles of the NFW component and the surrounding halos, respectively.
Current usage metrics show cumulative count of Article Views (full-text article views including HTML views, PDF and ePub downloads, according to the available data) and Abstracts Views on Vision4Press platform.
Data correspond to usage on the plateform after 2015. The current usage metrics is available 48-96 hours after online publication and is updated daily on week days.
Initial download of the metrics may take a while.