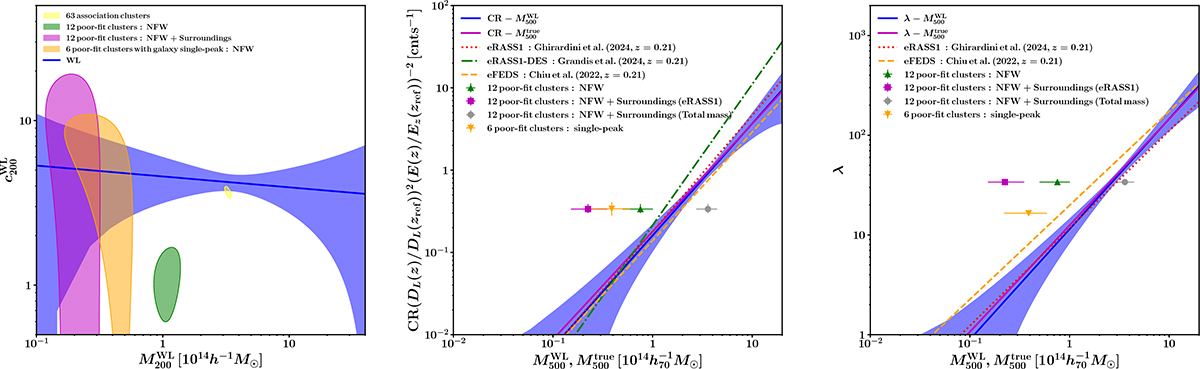
Fig. 13.
Download original image
Comparison of the baselines and the results of the poor-fit clusters. The green region and up-triangles are the results of the single NFW model for the 12 poor-fit clusters. The magenta region and squares are the results of the eRASS1 clusters considering the surrounding mass halos in the model fitting. The gray circles are the results of the total components, including the surrounding mass. The orange region and down-triangles are the results of the single NFW model for the six poor-fit clusters with a single galaxy peak. Left: Mass-concentration relation. Middle: Mass and the corrected CR relation. Right: Mass and richness relation. The lensing contribution from the surrounding halos cannot be ignored for the poor-fit clusters. Once we consider the surrounding halos, the concentration agrees with the baseline, but the masses expected from the count-rate or the richness are significantly overestimated.
Current usage metrics show cumulative count of Article Views (full-text article views including HTML views, PDF and ePub downloads, according to the available data) and Abstracts Views on Vision4Press platform.
Data correspond to usage on the plateform after 2015. The current usage metrics is available 48-96 hours after online publication and is updated daily on week days.
Initial download of the metrics may take a while.