Open Access
Fig. 15.
Download original image
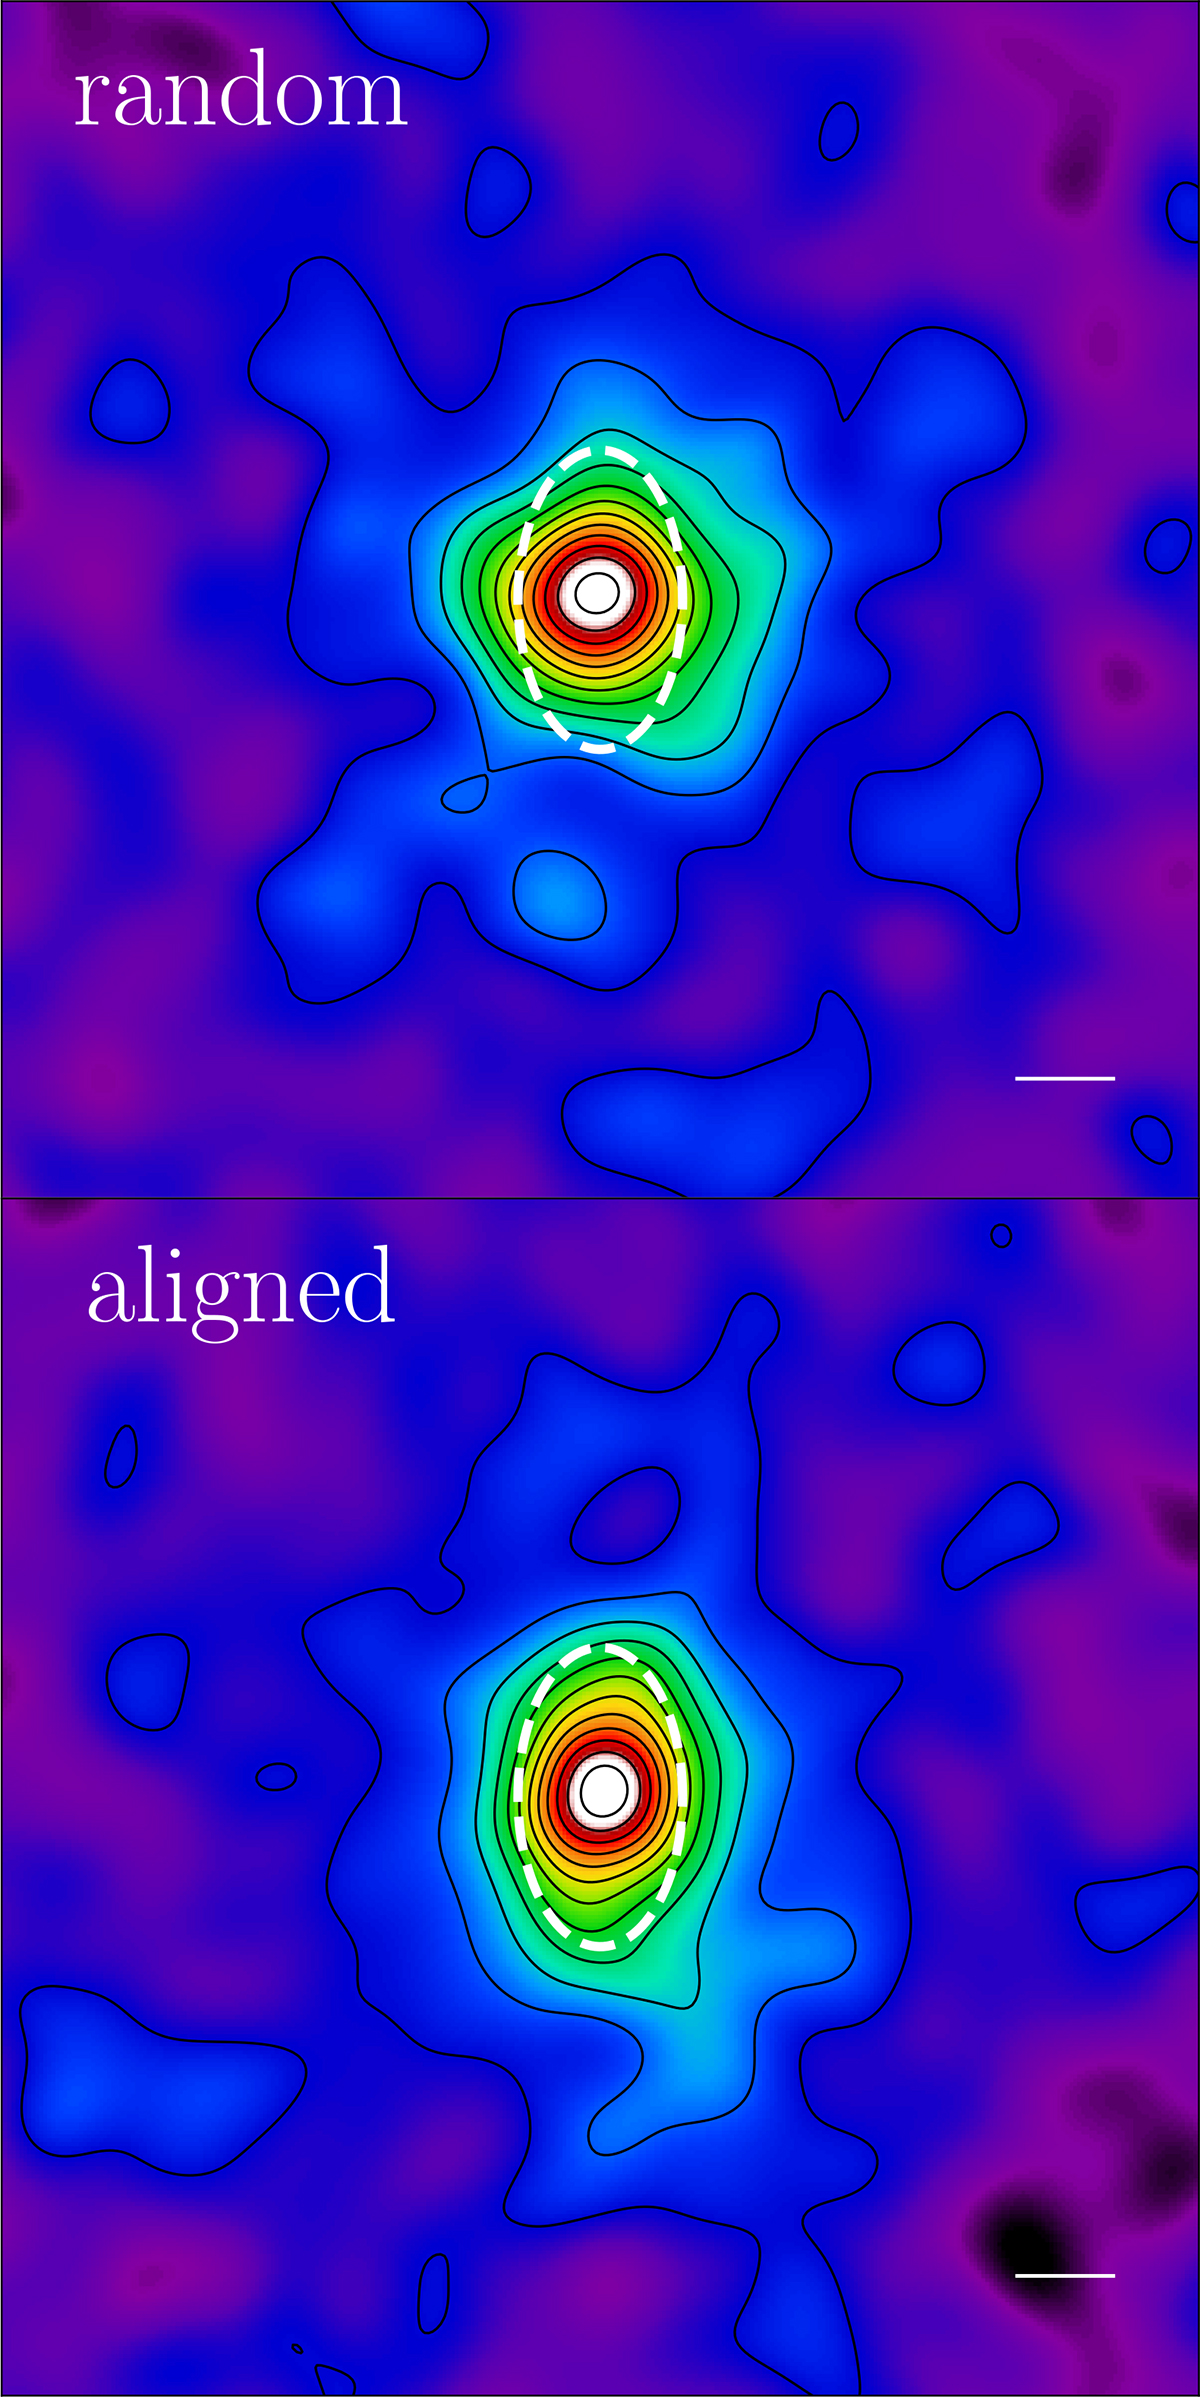
Stacked mass maps for the 34 clusters analyzed with the elliptical NFW model. Top: Random orientations. Bottom: Aligned the major axis with the y-axis. The white dashed lines are auxiliary lines reflecting the median ellipticity. The white solid lines at the bottom right represent the 1 arcmin smoothing scale.
Current usage metrics show cumulative count of Article Views (full-text article views including HTML views, PDF and ePub downloads, according to the available data) and Abstracts Views on Vision4Press platform.
Data correspond to usage on the plateform after 2015. The current usage metrics is available 48-96 hours after online publication and is updated daily on week days.
Initial download of the metrics may take a while.