Fig. 19.
Download original image
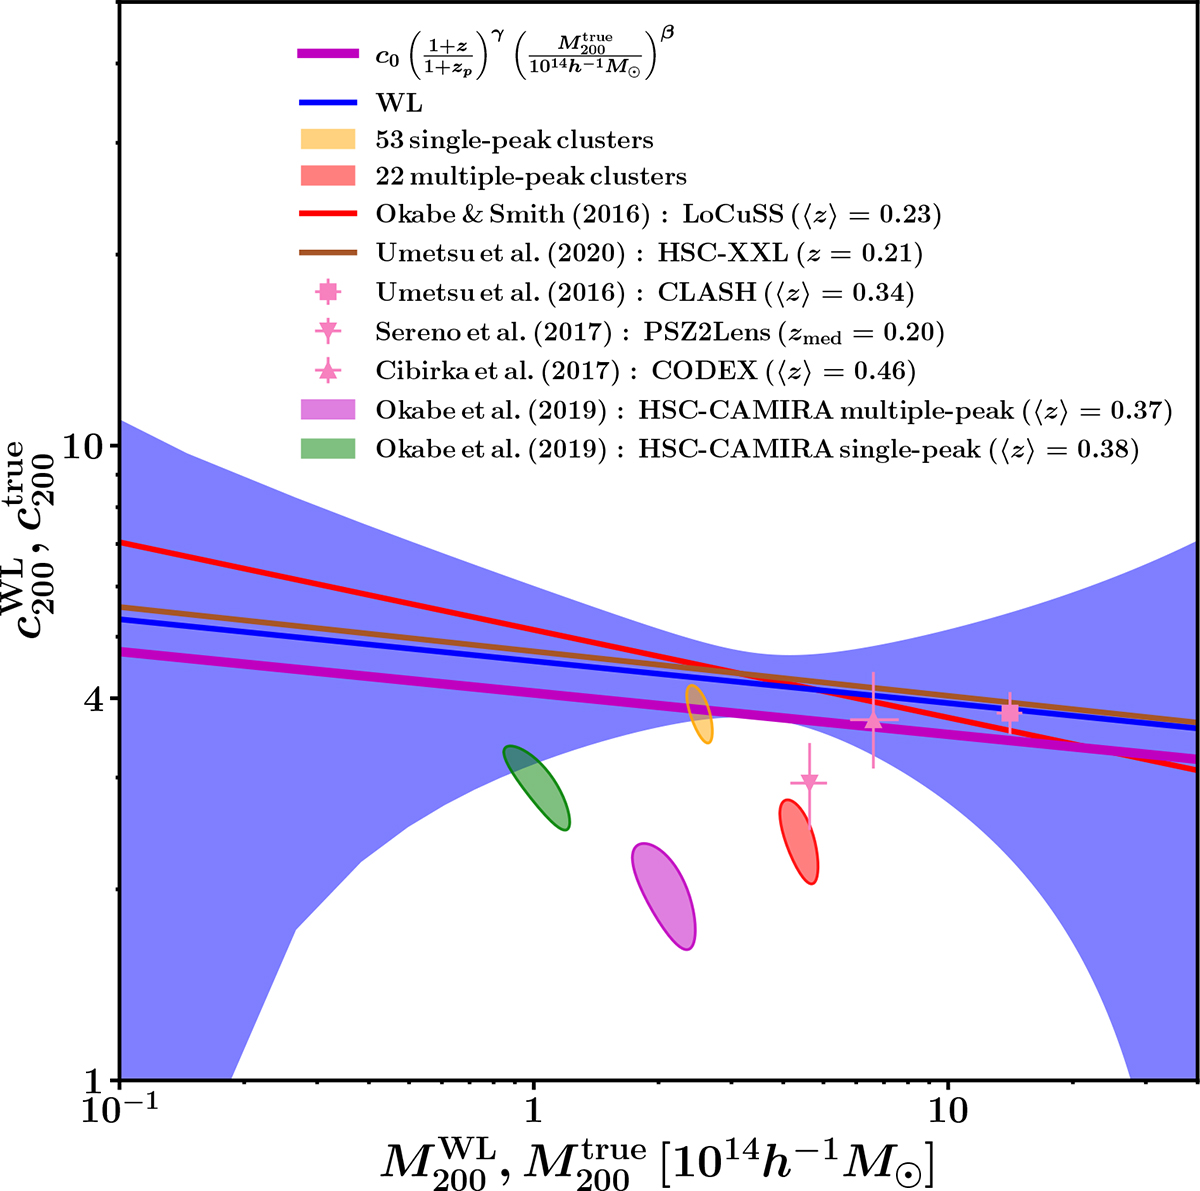
Comparison with the literature. The blue solid line and the blue region are the best-fit and the 1σ uncertainty (Fig. 8), respectively. The magenta line is the true mass and concentration relation. The red and brown lines are the best-fit lines of Okabe & Smith (2016) and Umetsu et al. (2020), respectively, where the redshift zref = 0.3 of Umetsu et al. (2020) is converted to z = 0.21. The orange and red shaded regions represent the 1σ constraints by stacked lensing analysis for the 53 clusters with single galaxy peak, and the 22 clusters with multiple galaxy peaks, respectively. The green and pink shaded regions represent the 1σ constraints by stacked lensing analysis for the HSC-CAMIRA clusters (Okabe et al. 2019) with single galaxy peak and multiple galaxy peaks, respectively. The pink square, up-triangle and down-triangle are the results of stacked lensing analyses of Umetsu et al. (2016), Cibirka et al. (2017) and Sereno et al. (2017), respectively.
Current usage metrics show cumulative count of Article Views (full-text article views including HTML views, PDF and ePub downloads, according to the available data) and Abstracts Views on Vision4Press platform.
Data correspond to usage on the plateform after 2015. The current usage metrics is available 48-96 hours after online publication and is updated daily on week days.
Initial download of the metrics may take a while.