Fig. 2.
Download original image
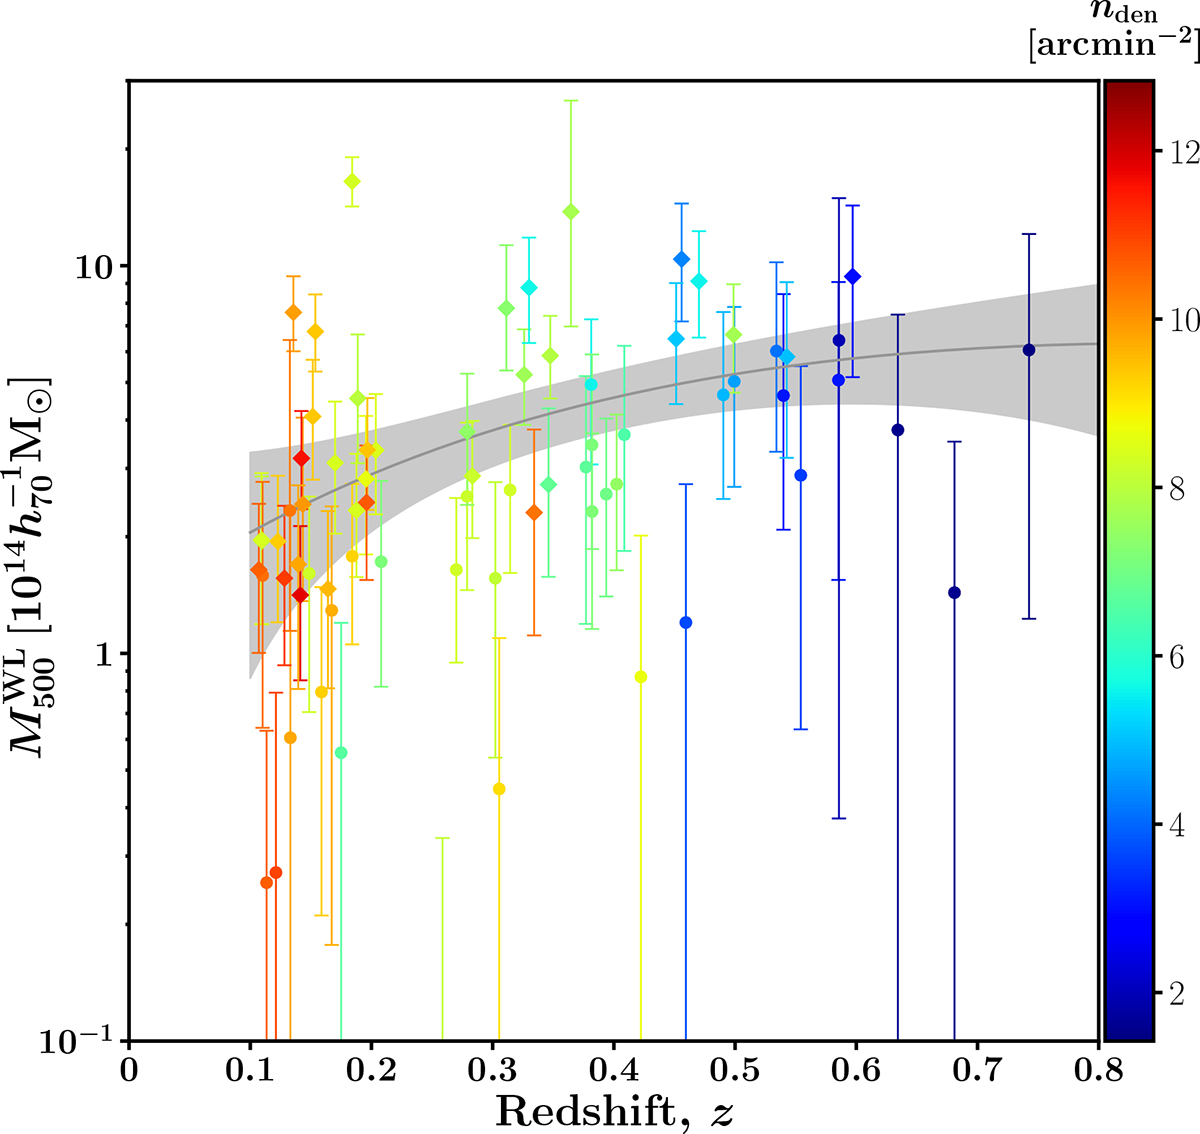
Weak-lensing masses (![]() [
[![]() ]) versus redshift. The symbols are the same as in Fig. 1. Colors denote the background number density, nden [arcmin−2]. The gray solid line and regions are the mean and 1σ region for the WL mass distribution in the parent sample obtained by the multivariate scaling relation analysis (Sect. 3.4), respectively.
]) versus redshift. The symbols are the same as in Fig. 1. Colors denote the background number density, nden [arcmin−2]. The gray solid line and regions are the mean and 1σ region for the WL mass distribution in the parent sample obtained by the multivariate scaling relation analysis (Sect. 3.4), respectively.
Current usage metrics show cumulative count of Article Views (full-text article views including HTML views, PDF and ePub downloads, according to the available data) and Abstracts Views on Vision4Press platform.
Data correspond to usage on the plateform after 2015. The current usage metrics is available 48-96 hours after online publication and is updated daily on week days.
Initial download of the metrics may take a while.