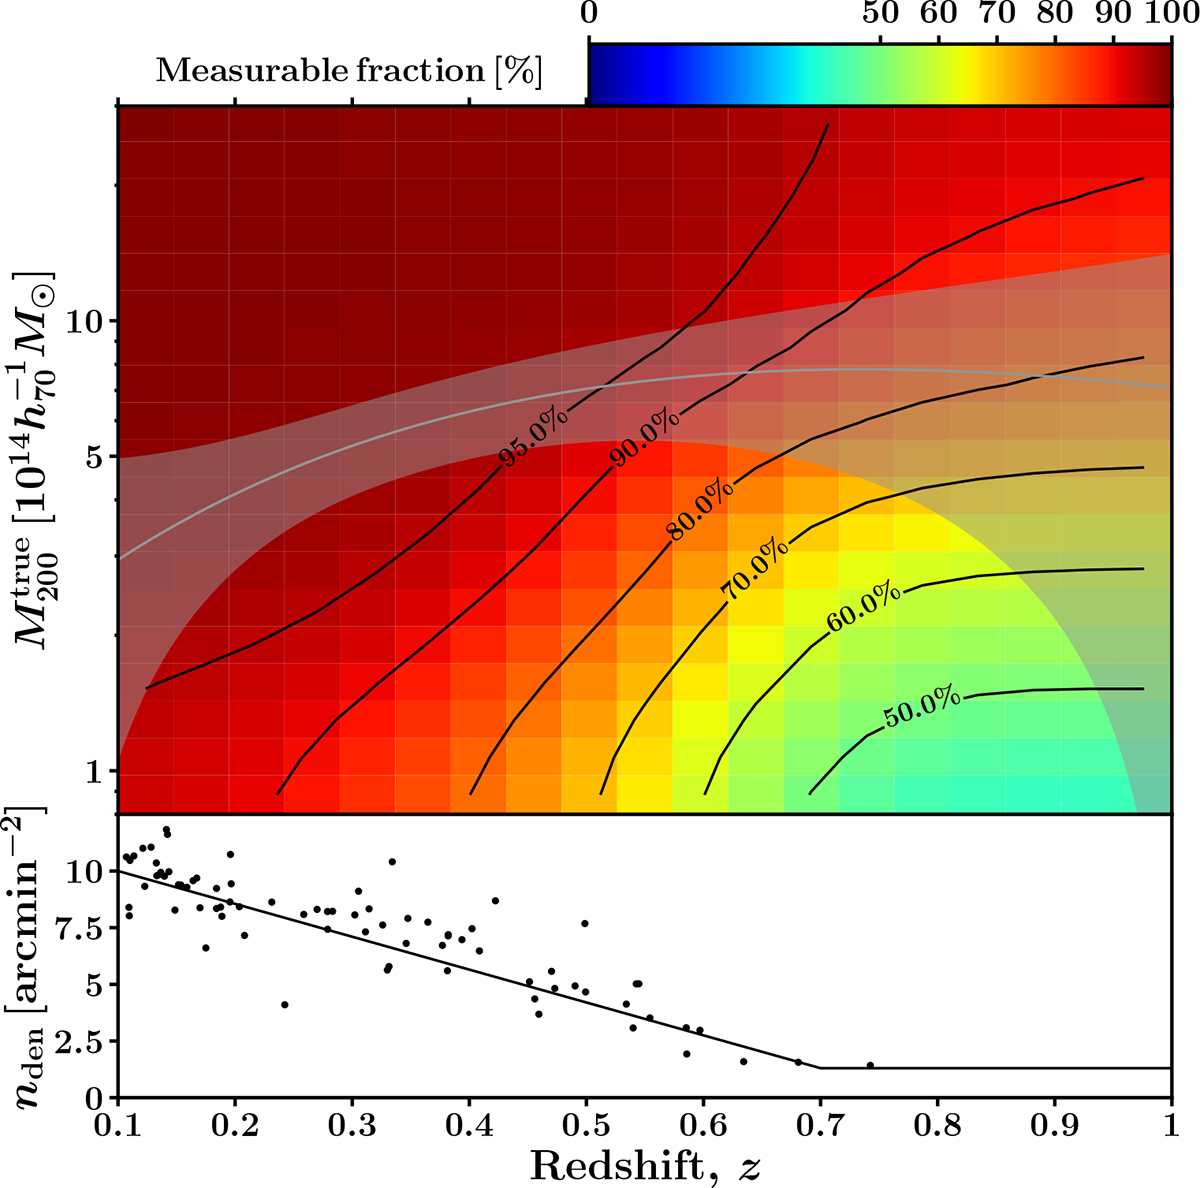
Fig. B.1.
Download original image
Top: Fraction of 9000 synthetic clusters for which WL masses can be measured in the ![]() and z plane. The background colors are smoothed with a Gaussian kernel of dz = 0.1 and
and z plane. The background colors are smoothed with a Gaussian kernel of dz = 0.1 and ![]() for a visual purpose. The gray shadow region represents the true mass distribution obtained by a scaling relation analysis (Sec 3.4). Bottom: Number densities as a function of cluster redshifts. The black solid line represents the model distribution used in the mock analysis.
for a visual purpose. The gray shadow region represents the true mass distribution obtained by a scaling relation analysis (Sec 3.4). Bottom: Number densities as a function of cluster redshifts. The black solid line represents the model distribution used in the mock analysis.
Current usage metrics show cumulative count of Article Views (full-text article views including HTML views, PDF and ePub downloads, according to the available data) and Abstracts Views on Vision4Press platform.
Data correspond to usage on the plateform after 2015. The current usage metrics is available 48-96 hours after online publication and is updated daily on week days.
Initial download of the metrics may take a while.