Fig. B.2.
Download original image
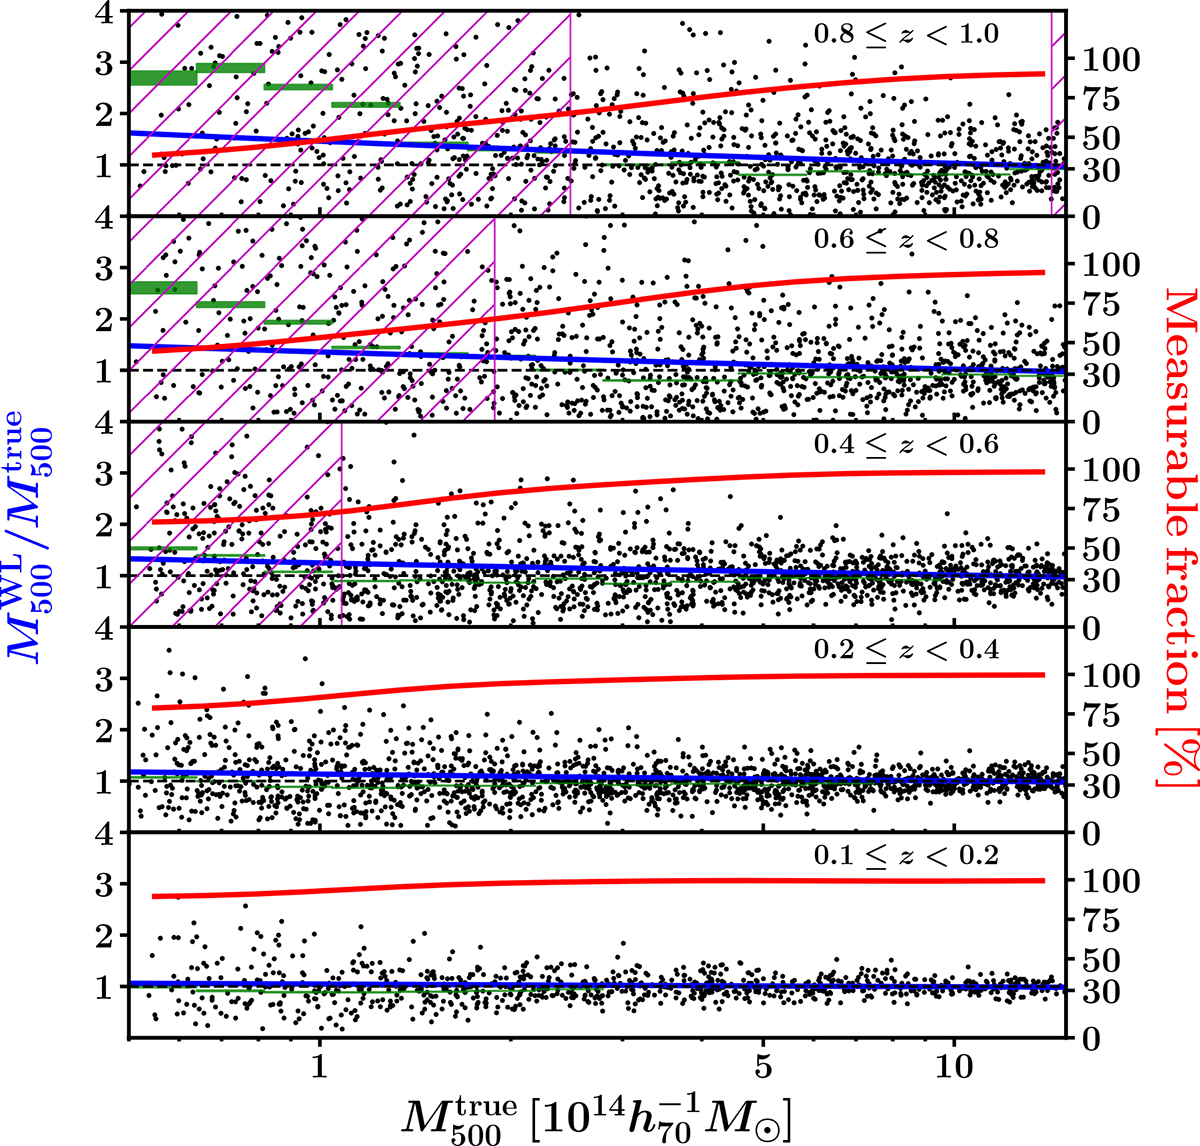
Mass bias, ![]() , in five redshift bins. The black points are the mass bias for individual mock clusters. We ignore their errors for a visual purpose. The green boxes are the average WL bias in each mass bin. The red solid lines are the measurable fraction. The higher the redshift and the lower the mass, the more difficult it is to measure WL masses and the lower the measurable fraction. This leads to a selection mass bias in the measured quantities. The magenta hatched boxes are excluded regions in the mass bias fit, where the probability of the target clusters being present is less than 10−6. The blue solid lines are the best-fit scaling relations for the mass bias.
, in five redshift bins. The black points are the mass bias for individual mock clusters. We ignore their errors for a visual purpose. The green boxes are the average WL bias in each mass bin. The red solid lines are the measurable fraction. The higher the redshift and the lower the mass, the more difficult it is to measure WL masses and the lower the measurable fraction. This leads to a selection mass bias in the measured quantities. The magenta hatched boxes are excluded regions in the mass bias fit, where the probability of the target clusters being present is less than 10−6. The blue solid lines are the best-fit scaling relations for the mass bias.
Current usage metrics show cumulative count of Article Views (full-text article views including HTML views, PDF and ePub downloads, according to the available data) and Abstracts Views on Vision4Press platform.
Data correspond to usage on the plateform after 2015. The current usage metrics is available 48-96 hours after online publication and is updated daily on week days.
Initial download of the metrics may take a while.