Fig. D.1.
Download original image
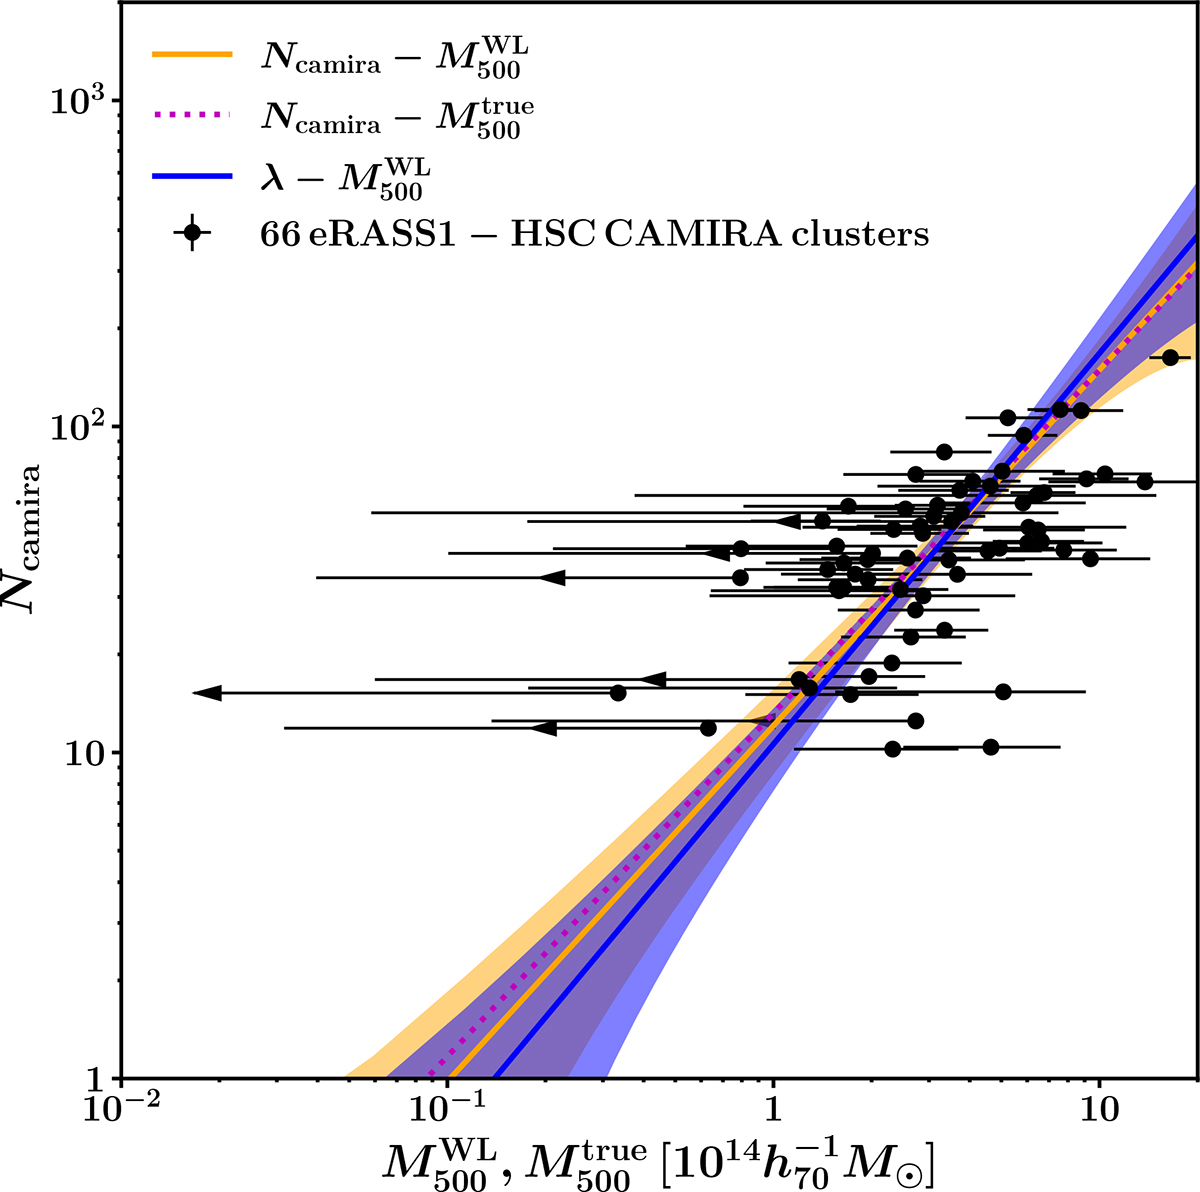
The CAMIRA richness and mass scaling relation. The black circles denote the overlapped 66 clusters. The orange solid and magenta dotted lines are the best-fit scaling relations concerning the WL and true masses, respectively. The orange region is the 1σ uncertainty of the scaling relation with the WL masses. The blue solid line and region are the best-fit and 1σ uncertainty with the eRASS1 richness (Fig. 7), respectively.
Current usage metrics show cumulative count of Article Views (full-text article views including HTML views, PDF and ePub downloads, according to the available data) and Abstracts Views on Vision4Press platform.
Data correspond to usage on the plateform after 2015. The current usage metrics is available 48-96 hours after online publication and is updated daily on week days.
Initial download of the metrics may take a while.