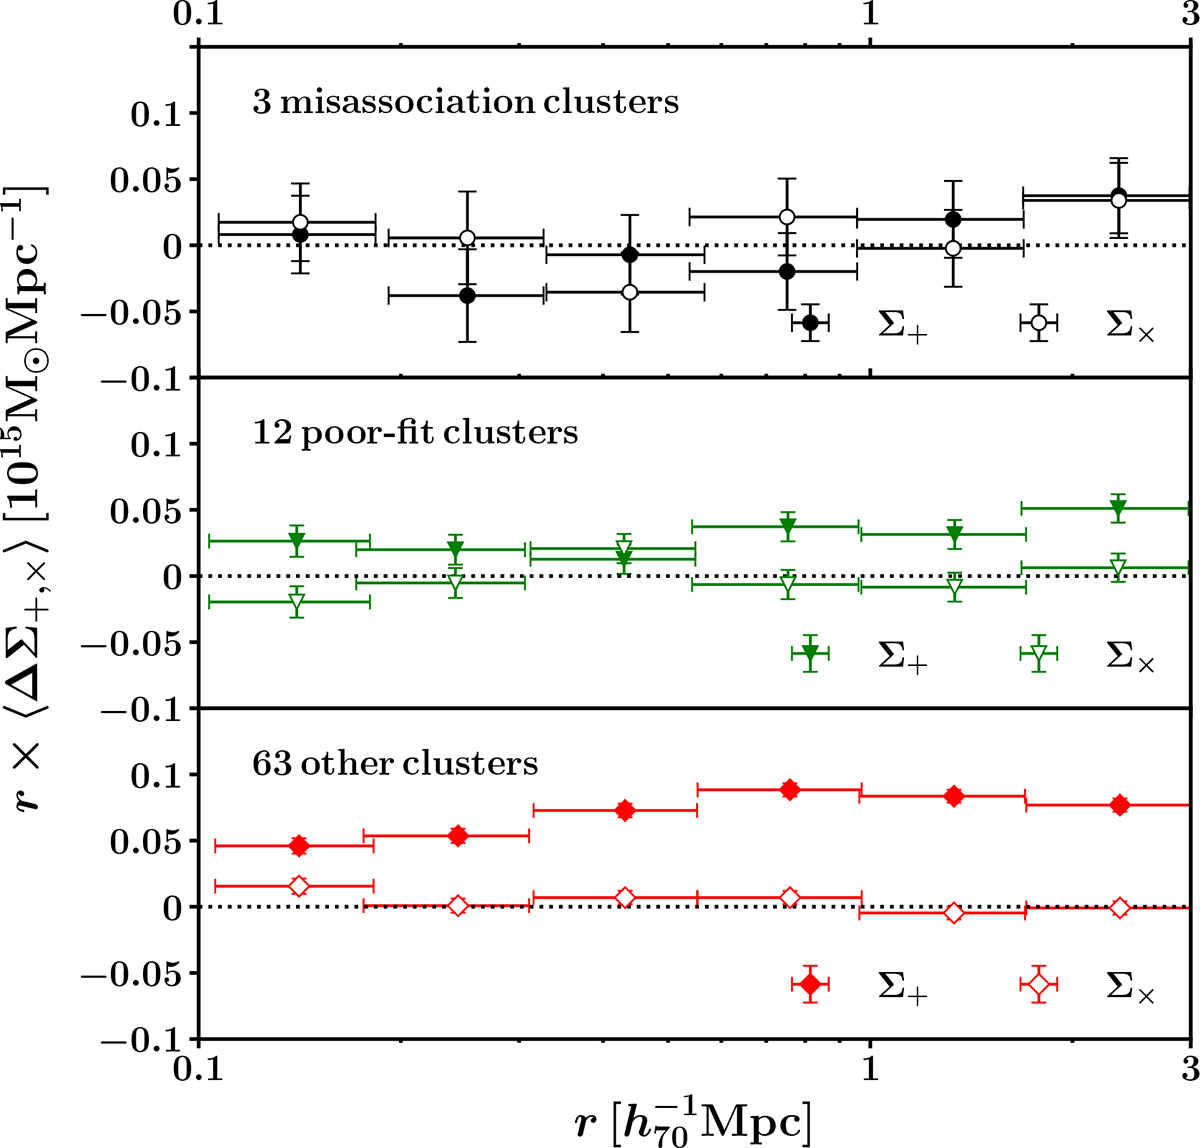
Fig. 5.
Download original image
Stacked profiles for the three misassociation clusters (top), the 12 poor-fit clusters (middle), and the 63 other clusters (bottom). The y-axis represents r × ⟨Σ+⟩ (filled colors) or r × ⟨Σ×⟩ (open colors). The + components for the 63 other clusters and the 12 poor-fit clusters are higher than the × components, while both the + and × components for the 3 misassociation clusters are consistent with the null.
Current usage metrics show cumulative count of Article Views (full-text article views including HTML views, PDF and ePub downloads, according to the available data) and Abstracts Views on Vision4Press platform.
Data correspond to usage on the plateform after 2015. The current usage metrics is available 48-96 hours after online publication and is updated daily on week days.
Initial download of the metrics may take a while.