Fig. 1
Download original image
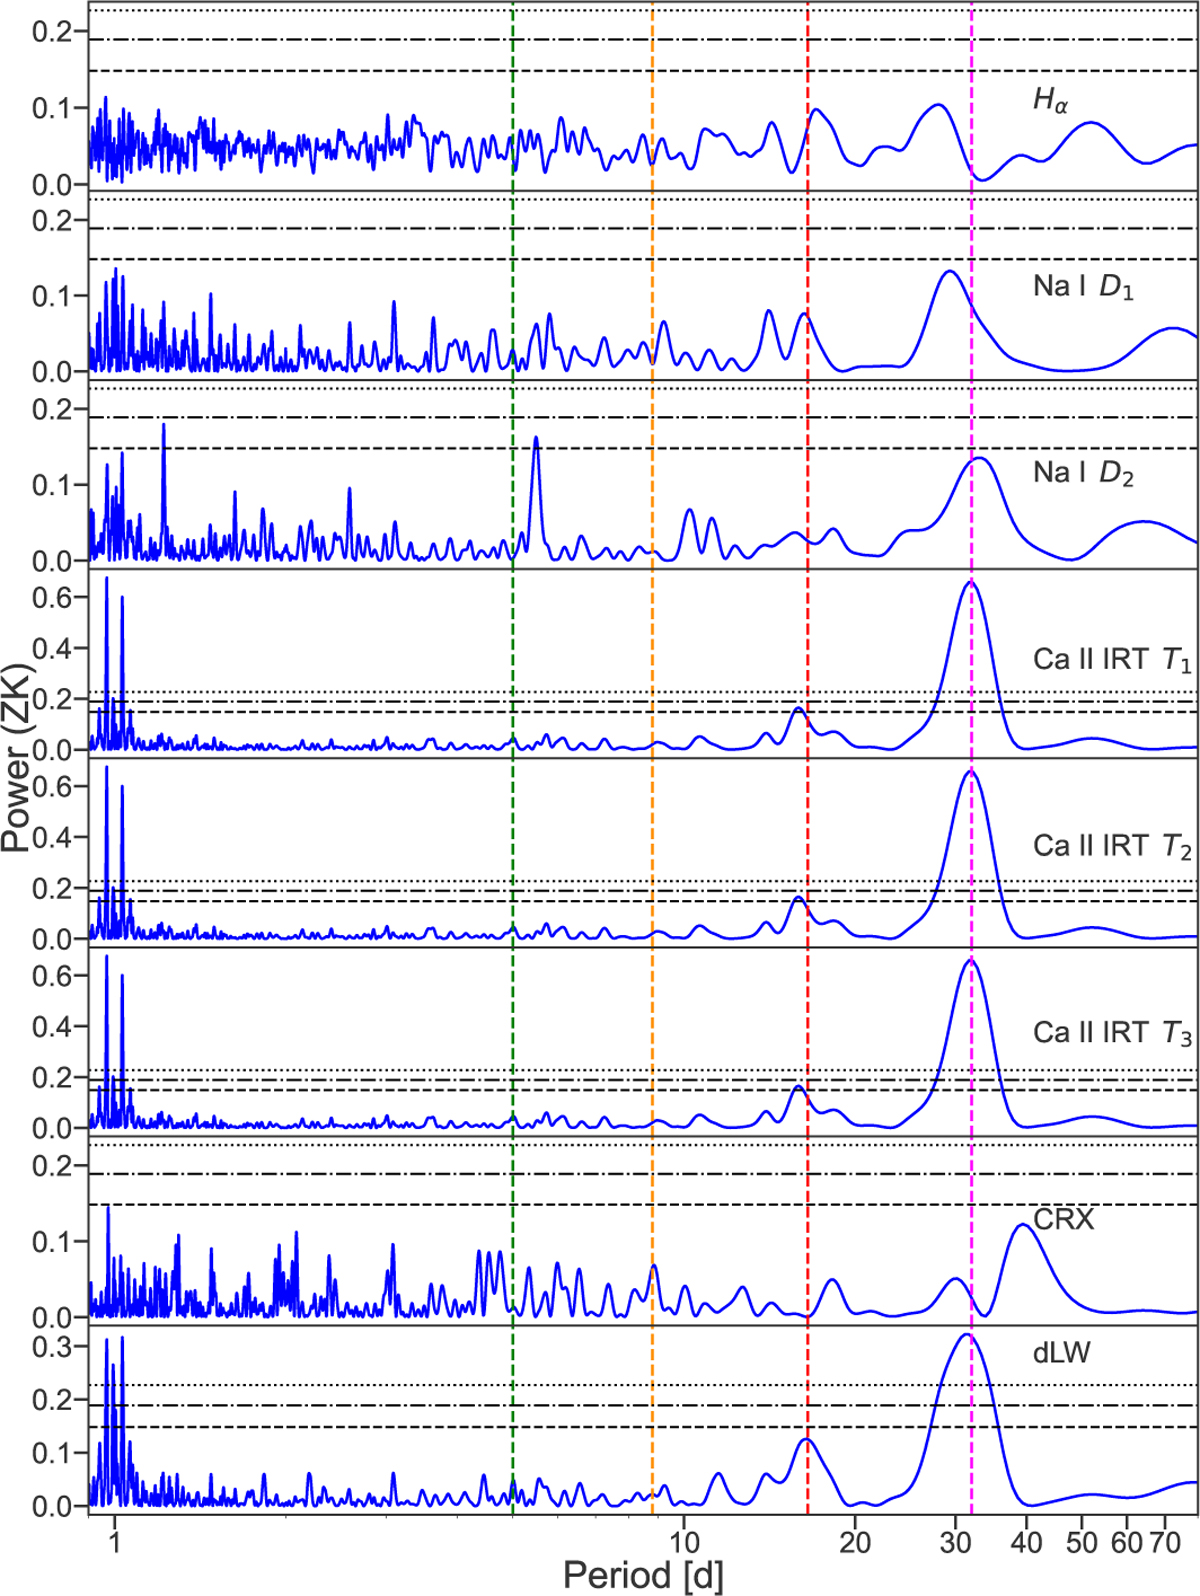
GLS periodogram of serval activity indicators. From top to bottom: Hα λ6562.81A, NaI D1 and D2 λλ5889.9, 5895.92Ǻ, CaII IRT λλλ 8498.02,8542.09,8662.14 Ǻ, CRX, and dLW periodograms. In all panels, the period of the planet candidate at 5.01 d is marked with a vertical dashed green line, and the star-related signals at 8, 16, and 32 days are marked in orange, red, and magenta, respectively. The 10%, 1%, and 0.1% FAPs are marked as horizontal dashed, dash-dotted, and dotted horizontal lines, respectively. The peaks near one day correspond to aliases of the stellar rotation signal, introduced by the daily sampling of ground-based observations.
Current usage metrics show cumulative count of Article Views (full-text article views including HTML views, PDF and ePub downloads, according to the available data) and Abstracts Views on Vision4Press platform.
Data correspond to usage on the plateform after 2015. The current usage metrics is available 48-96 hours after online publication and is updated daily on week days.
Initial download of the metrics may take a while.