Fig. A.3
Download original image
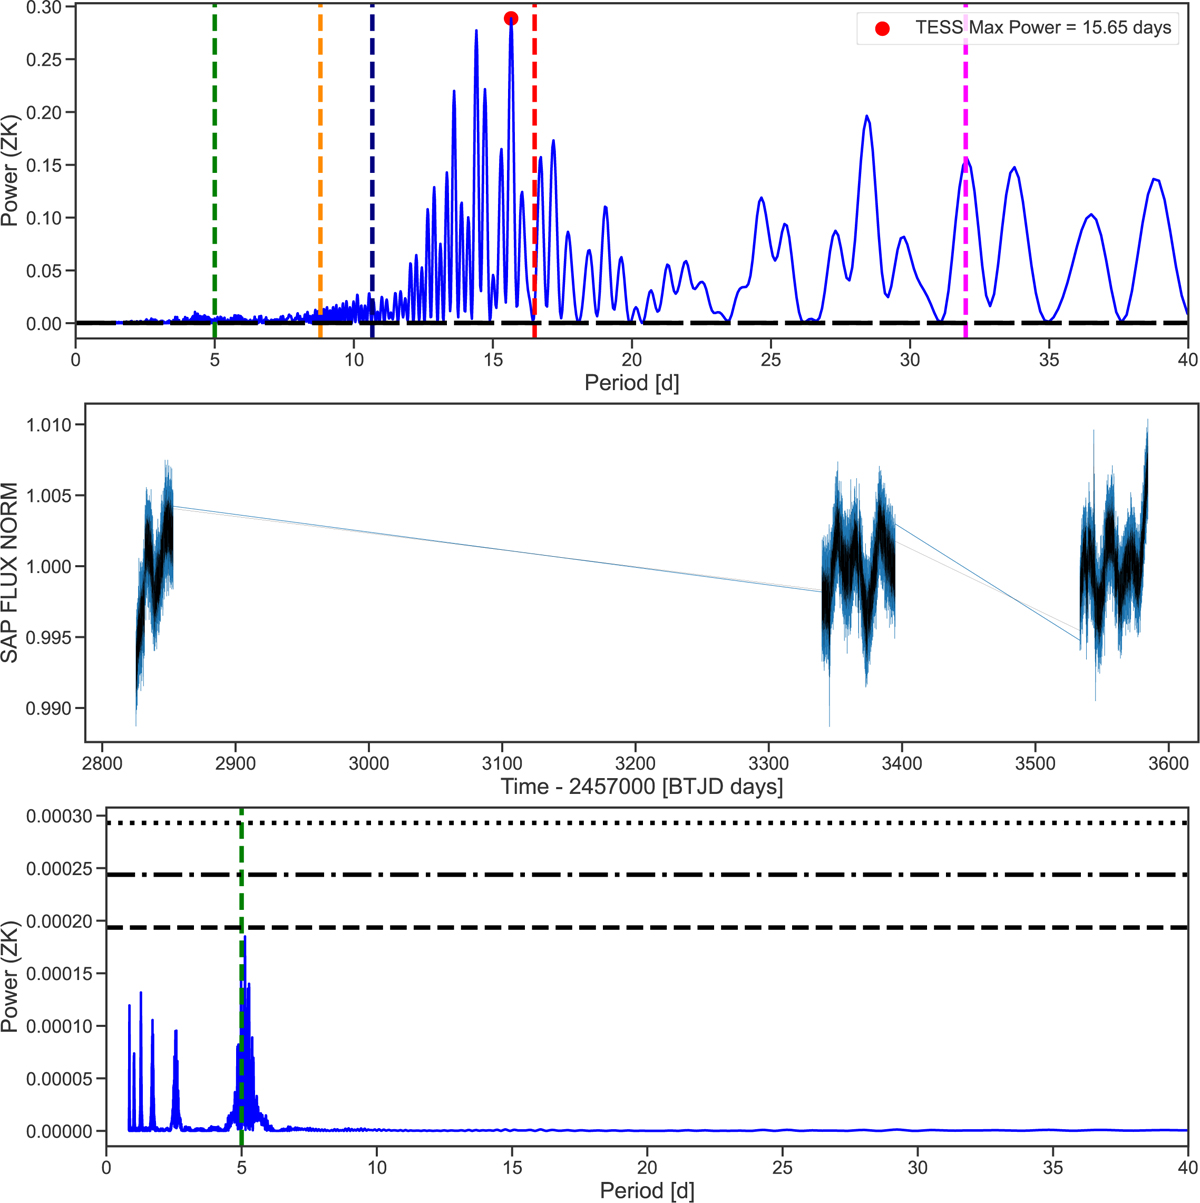
Periodicity analysis of the TESS SAP flux of Ross 176. The 10%, 1% and 0.1% FAP levels in the GLS panels are marked as horizontal dashed, dash-dotted and dotted gray lines, respectively. Top panel: GLS periodogram for the SAP data, following the same color criteria for the vertical lines with an exception of the new dark blue line which points out the second harmonic of the stellar rotation period (Prot)/3 ∼ 10-11 days. Mid panel: median-normalized SAP LC (blue data points) along with the GP celerite quasi-periodic kernel model with a GP_Prot around 32 days (black line). Bottom panel: GLS periodogram of the SAP light curve residuals after subtracting the GP model from the photometric dataset. The period of Ross 176b at 5.01 d (green line) and the FAP lines are also represented.
Current usage metrics show cumulative count of Article Views (full-text article views including HTML views, PDF and ePub downloads, according to the available data) and Abstracts Views on Vision4Press platform.
Data correspond to usage on the plateform after 2015. The current usage metrics is available 48-96 hours after online publication and is updated daily on week days.
Initial download of the metrics may take a while.