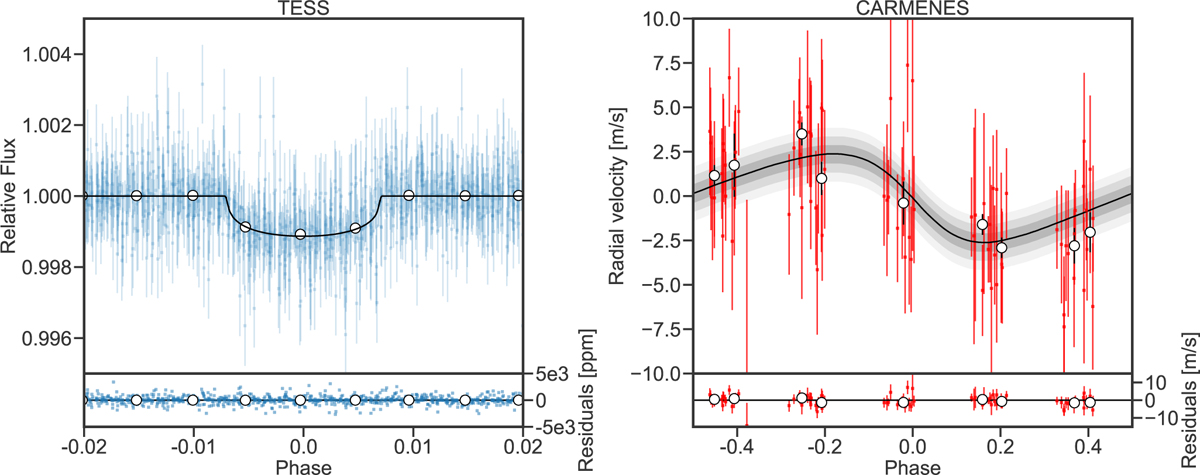
Fig. 4
Download original image
Phase-folded joint fit of Ross 176 b. Left panel: phase-folded transits from TESS (blue points) with the joint-fit model (black line). Right panel: phase-folded RV data from CARMENES (red points), with the joint-fit model (black line), and the 1σ, 2σ, and 3σ confidence intervals for the model (shaded gray areas). The two panels show the binned data for clarity (white points), the residuals from the fit at the bottom, and the error bars include the instrumental jitter term added in quadrature. The LC data are binned by ∼30 mins, and the RV data are binned by two points every 0.2 phase.
Current usage metrics show cumulative count of Article Views (full-text article views including HTML views, PDF and ePub downloads, according to the available data) and Abstracts Views on Vision4Press platform.
Data correspond to usage on the plateform after 2015. The current usage metrics is available 48-96 hours after online publication and is updated daily on week days.
Initial download of the metrics may take a while.