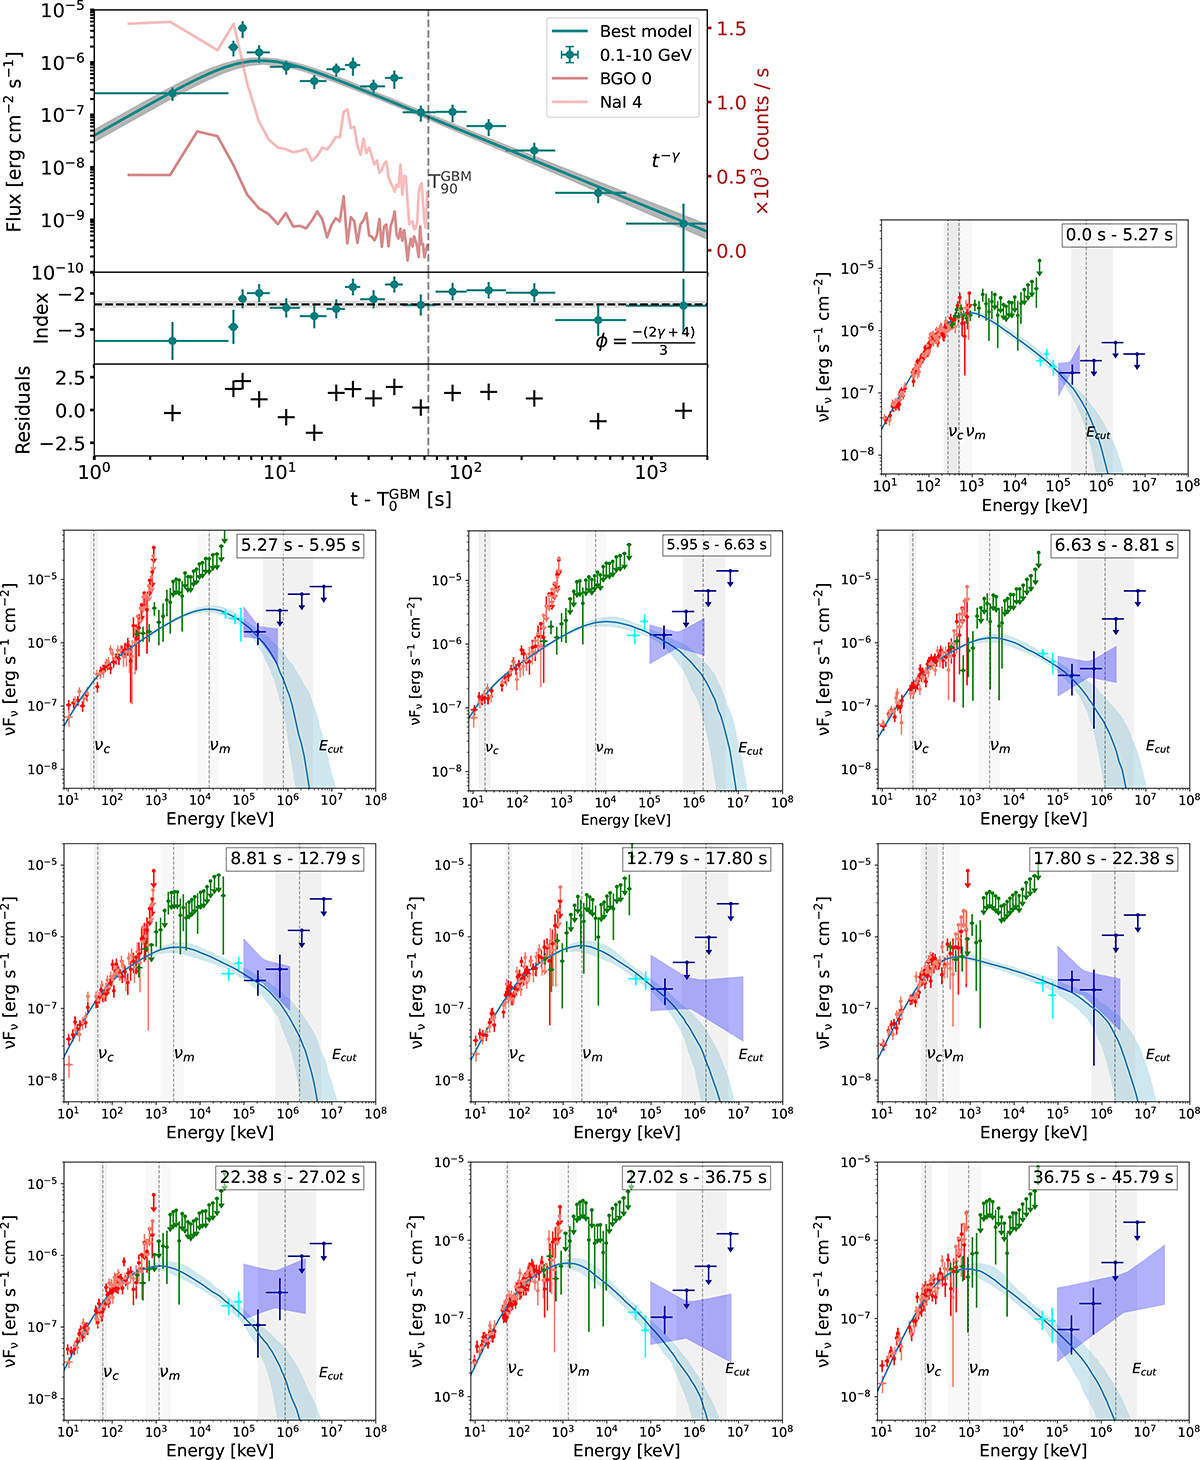
Fig. 2.
Download original image
Time-resolved spectral analysis of GRB 080916C. The upper-left panel shows the fit of the LAT light curve (0.1–10 GeV) with the model from Eq. 1, along with GBM light curves (BGO and NaI). The middle panel compares the inferred spectral index (ϕ) with the observed spectral index, with the shaded grey area representing uncertainties on the predicted index, derived from the decay temporal index fit. The bottom panel shows the residuals, indicating the deviation of the light curve from the model. The remaining panels show the time-resolved spectral fits. Details are provided in Table A.1.
Current usage metrics show cumulative count of Article Views (full-text article views including HTML views, PDF and ePub downloads, according to the available data) and Abstracts Views on Vision4Press platform.
Data correspond to usage on the plateform after 2015. The current usage metrics is available 48-96 hours after online publication and is updated daily on week days.
Initial download of the metrics may take a while.