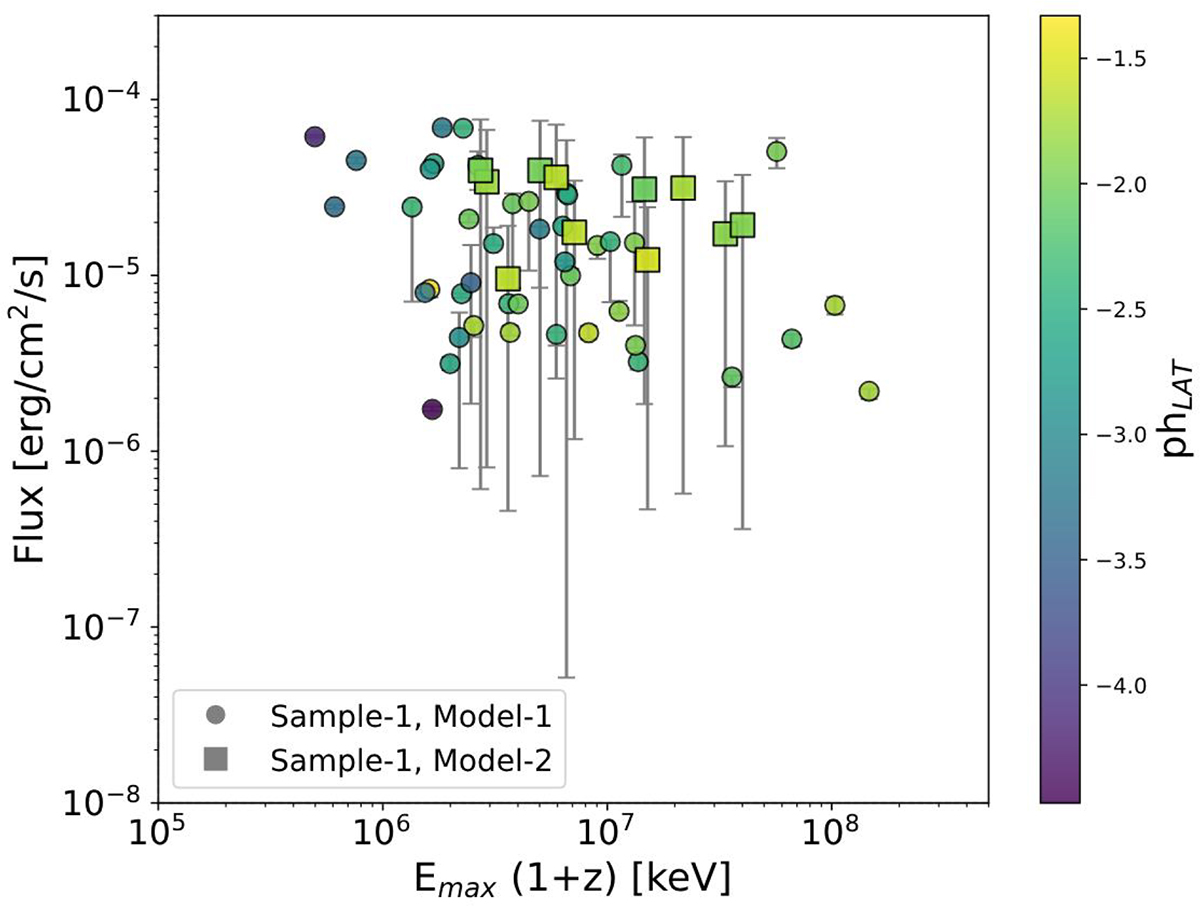
Fig. 6.
Download original image
Bolometric flux vs. Emax for the GRBs in Sample-1. Each entry in the plot represents a spectrum of Sample-1. The best-fitted models (Model-1 or Model-2) of the individual spectrum are indicated with different markers. The colour bar indicates the corresponding spectral index for each spectrum (represented by each point in the graph) in the high-energy gamma-rays detected with LAT. The highest-energy photons are represented in the co-moving frame. For each spectrum the corresponding LAT photon index in the energy range 0.1–10 GeV is indicated by a colour gradient.
Current usage metrics show cumulative count of Article Views (full-text article views including HTML views, PDF and ePub downloads, according to the available data) and Abstracts Views on Vision4Press platform.
Data correspond to usage on the plateform after 2015. The current usage metrics is available 48-96 hours after online publication and is updated daily on week days.
Initial download of the metrics may take a while.