Open Access
Fig. A.3.
Download original image
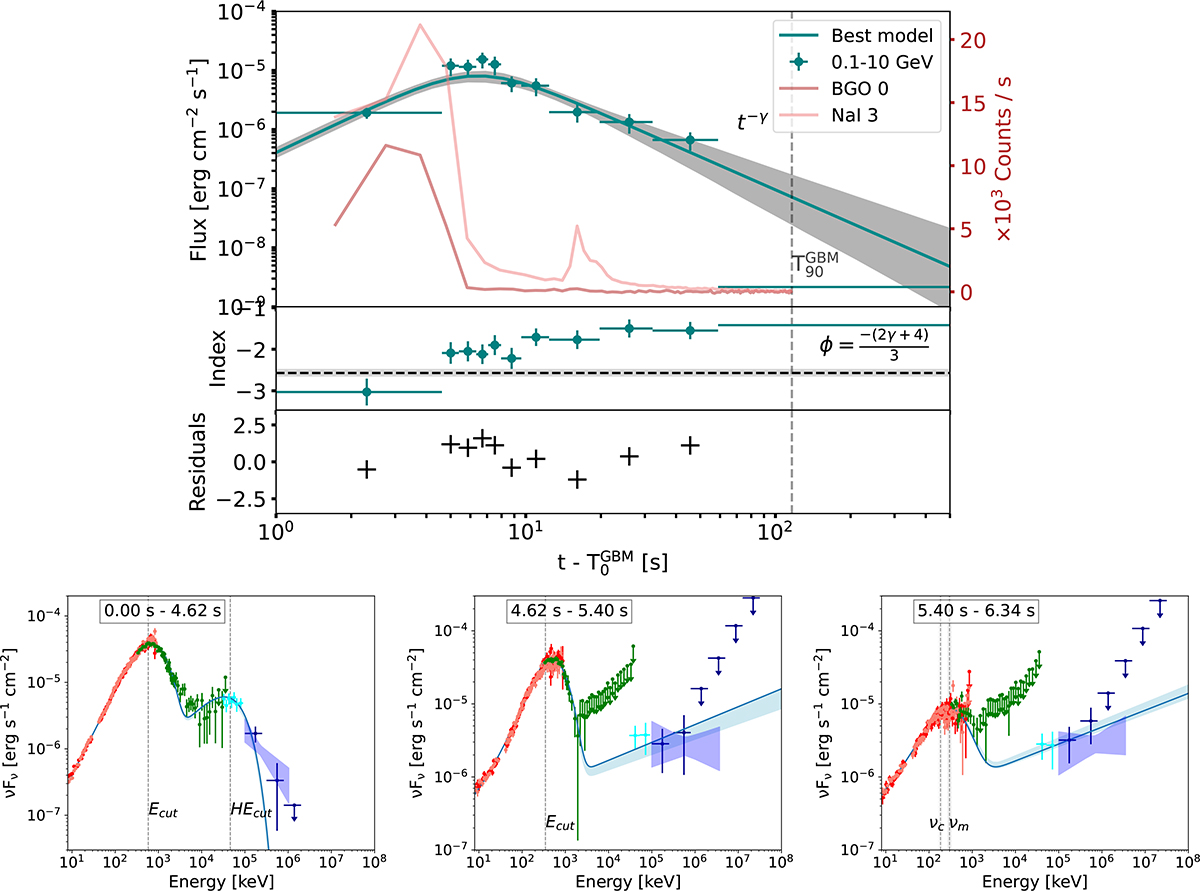
Same as Fig.2, but for GRB 190114C. The upper-left panel shows the LAT and the GBM light curves. The middle panel compares the inferred spectral index ϕ with the observed one. The bottom panel presents residuals. The remaining panels display the time-resolved spectral fits. See Table A.4 for the spectral fit parameters.
Current usage metrics show cumulative count of Article Views (full-text article views including HTML views, PDF and ePub downloads, according to the available data) and Abstracts Views on Vision4Press platform.
Data correspond to usage on the plateform after 2015. The current usage metrics is available 48-96 hours after online publication and is updated daily on week days.
Initial download of the metrics may take a while.