Fig. 1
Download original image
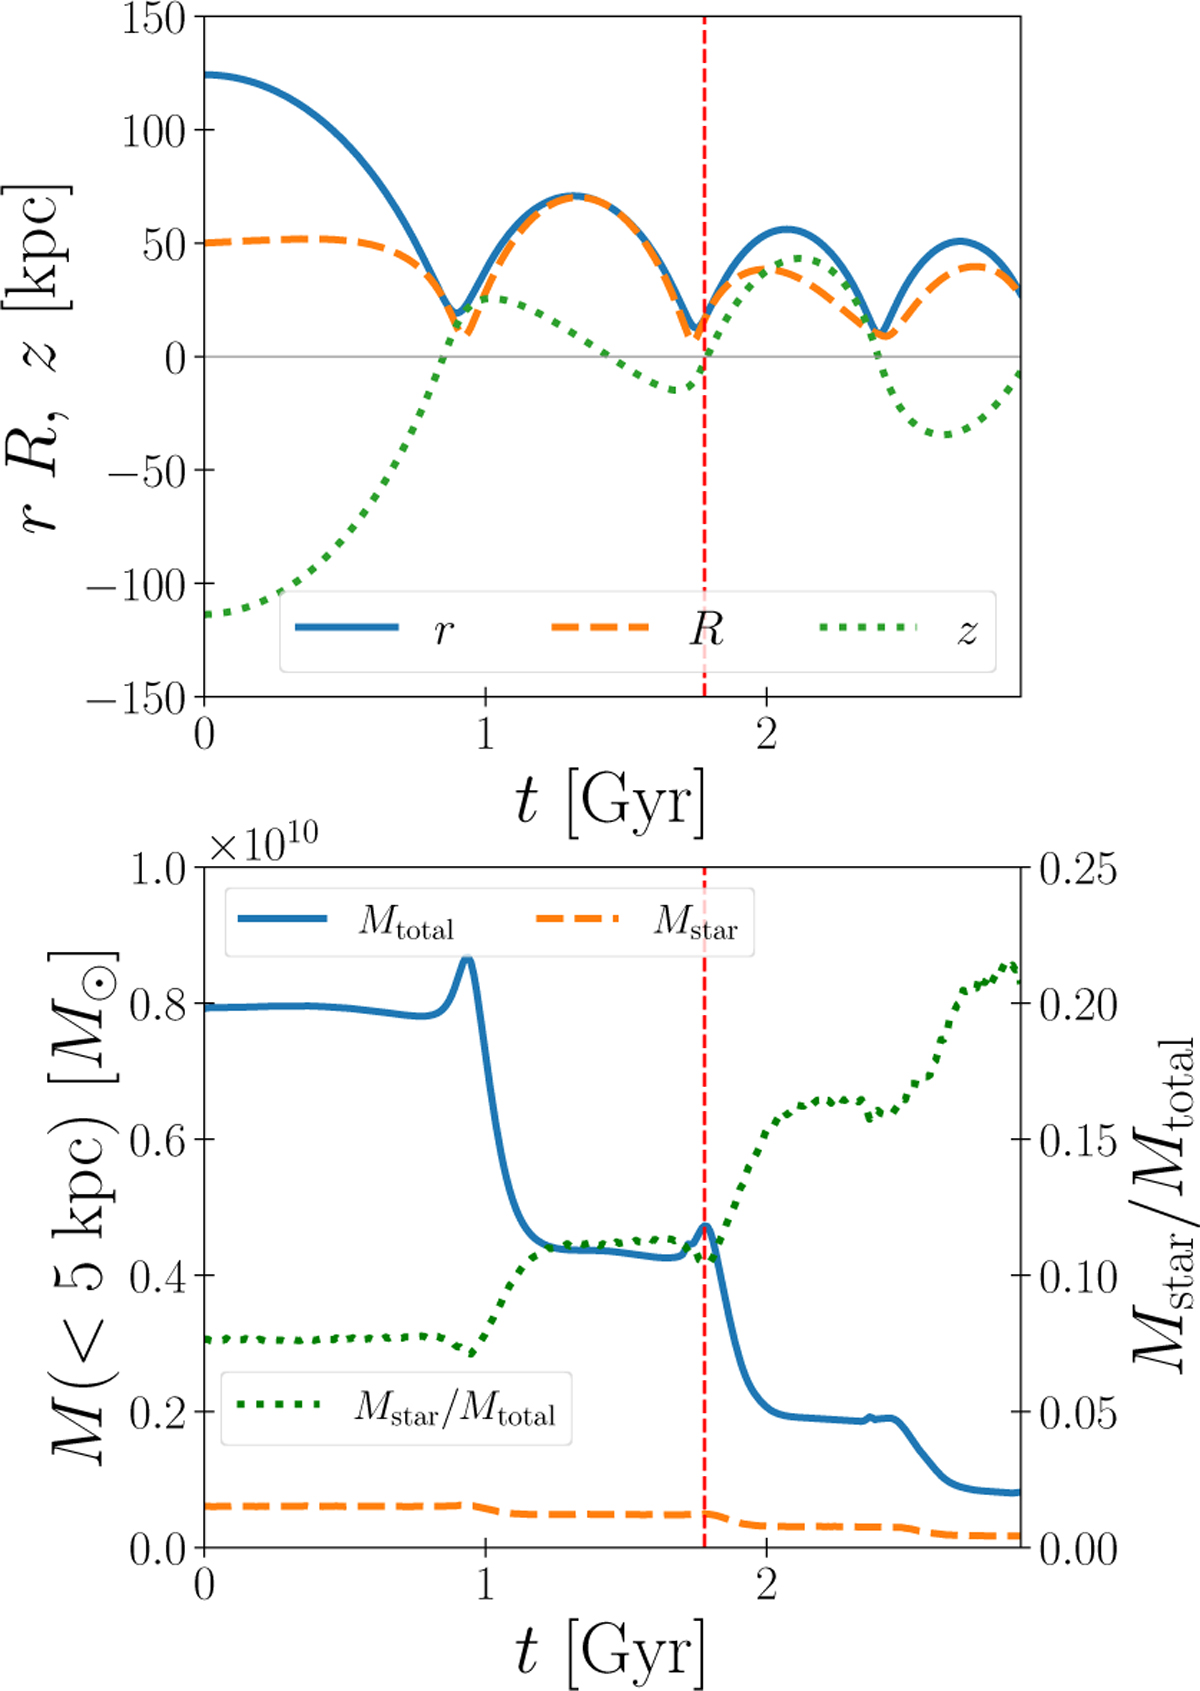
Upper panel: position of the dwarf as a function of time. Blue solid, orange dashed, and green dotted lines show ![]() , and z, respectively. Lower panel: mass of the dwarf as a function of time. Blue solid and orange dashed lines show the total mass and stellar mass enclosed within 5 kpc. The Green dotted line shows the stellar mass fraction. The red vertical line indicates the time of t = 1.78 Gyr when the dwarf’s position is close to the present-day position of the Sgr. The final total mass is consistent with the presentday Sgr mass.
, and z, respectively. Lower panel: mass of the dwarf as a function of time. Blue solid and orange dashed lines show the total mass and stellar mass enclosed within 5 kpc. The Green dotted line shows the stellar mass fraction. The red vertical line indicates the time of t = 1.78 Gyr when the dwarf’s position is close to the present-day position of the Sgr. The final total mass is consistent with the presentday Sgr mass.
Current usage metrics show cumulative count of Article Views (full-text article views including HTML views, PDF and ePub downloads, according to the available data) and Abstracts Views on Vision4Press platform.
Data correspond to usage on the plateform after 2015. The current usage metrics is available 48-96 hours after online publication and is updated daily on week days.
Initial download of the metrics may take a while.