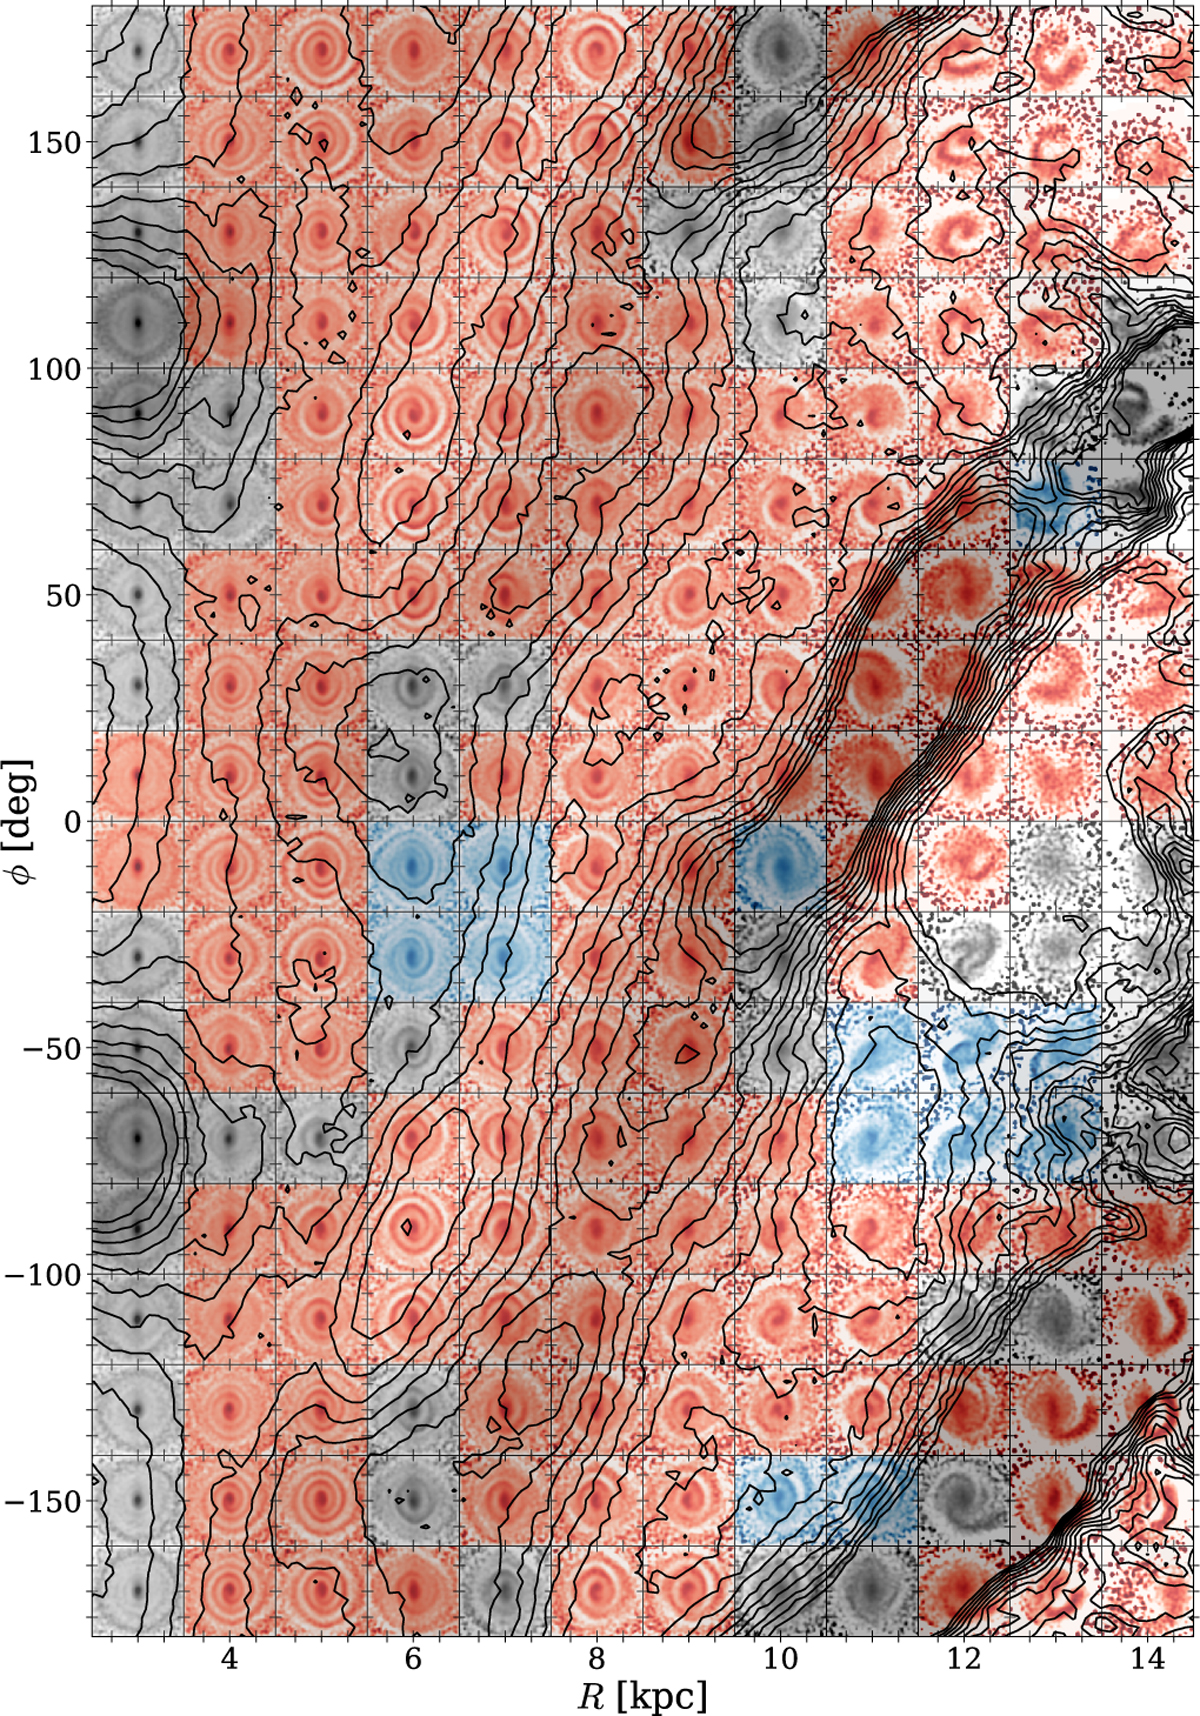
Fig. 10
Download original image
Variation of R−ϕ of the phase spiral in the snapshot at t= 1.47 Gyr. Each panel shows z/hz−vz/σz map for a set of particles grouped by R and ϕ. The maps are colour-coded by the density contrast, Δ ρ. Panels exhibiting one-arm phase spirals are painted in red tone, while those with two-arm phase spirals are painted in blue tone. Panels where the phase spiral shapes cannot be classified as either one-arm or two-arm are painted in grey tones. The surface density contour of Fig. 9 is overlaid. While one-arm phase spirals are widely observed, two-arm phase spirals are only found in limited areas.
Current usage metrics show cumulative count of Article Views (full-text article views including HTML views, PDF and ePub downloads, according to the available data) and Abstracts Views on Vision4Press platform.
Data correspond to usage on the plateform after 2015. The current usage metrics is available 48-96 hours after online publication and is updated daily on week days.
Initial download of the metrics may take a while.