Fig. 12
Download original image
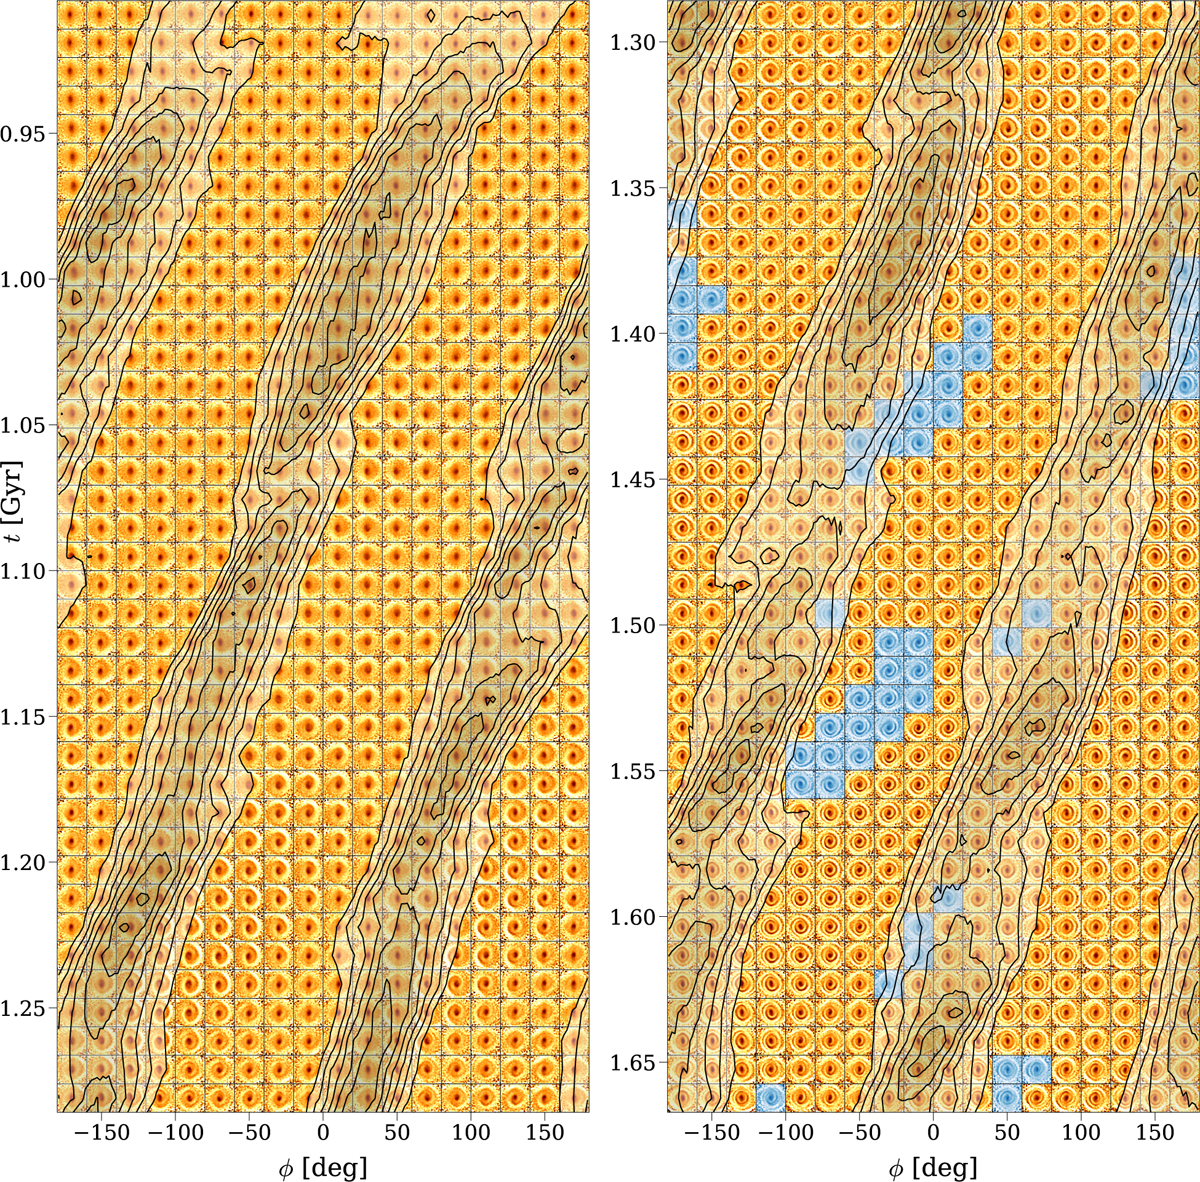
Time evolution of the phase spiral at R = 8 kpc. Columns represent azimuths equally spaced by 20°. Rows correspond to time, from t = 0.9 Gyr to 1.28 Gyr on the left block, and t = 1.29 Gyr to 1.67 Gyr on the right block. Each panel shows z/hz−vz/σz maps colour-coded by the density contrast, Δ ρ. Panels showing two-arm phase spirals are painted in blue tone. Contours indicate the normalised surface density, Σ(R = 8 kpc, ϕ, t)/Σ0(R = 8 kpc, t). Arm regions (Σ/Σ0>1) are shaded. One-arm spirals emerge first, followed by intermittent appearances of two-arm spirals around 200-250 Myr after the bending-to-breathing mode transition.
Current usage metrics show cumulative count of Article Views (full-text article views including HTML views, PDF and ePub downloads, according to the available data) and Abstracts Views on Vision4Press platform.
Data correspond to usage on the plateform after 2015. The current usage metrics is available 48-96 hours after online publication and is updated daily on week days.
Initial download of the metrics may take a while.